What is OKR?
The OKR framework helps to strategize goal execution on the company, team, or personal level according to any chosen timeframe (typically per quarter). Within OKR, there are two main terms to be familiar with—objectives and key results—that provide the ability for each person to prioritize, align, and measure the outcome of their work.
- Objectives relate to specific, time-bound goals for the company, team, and employee
- Key results are targets, or milestones, that need to be completed in order to achieve the set objectives
Another aspect of this methodology is the collaborative team "grading" of each completed key result on a scale of 0-0.1 (or 0-100%). This typically occurs in recurring syncs which are done in a weekly or monthly cadence.
What are the benefits?
Now that you have more of an understanding of what OKR is, you may be asking yourself "how could my team and I benefit from using this framework?" In short, equipping your team with the OKR framework provides a sense of structure, alignment and direction towards larger goals, thereby enabling transparency, accountability and optimal impact within your organization.
Additionally, grading key results as a team provides the ability to reflect on and optimize the strategies in place in order to assess efforts and best prepare for the future ahead!
Set up an OKR board
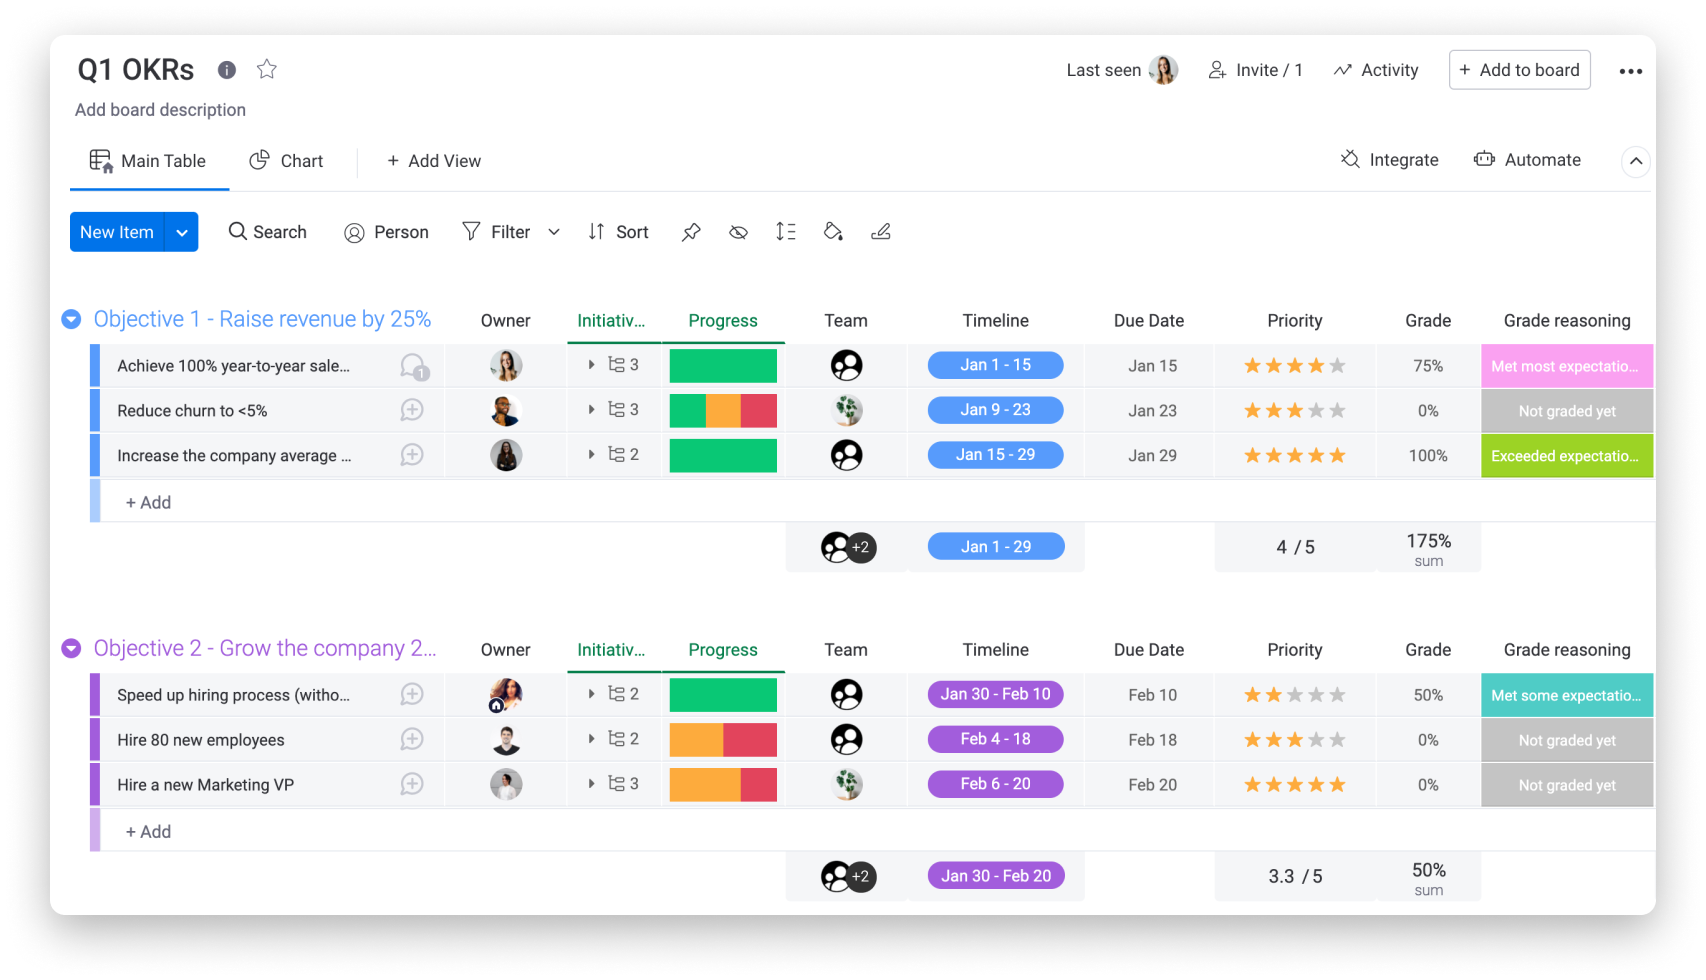
Using monday.com, planning out your OKR workflow has never been easier! As an example, we use the below board to lay out our company goals and strategies (OKRs) for the first quarter of the year.
While an OKR board can be fully customized to suit your own needs, we chose to structure our board to display our OKRs for the first quarter of the year.
- Groups - to outline each objective that we are working towards in Q1
- Items - to represent each of the key results which need to be completed for each objective
- Columns - to display relevant data points for each of our key results. We used column types such as the People, Status, Timeline, and Formula Column
Add granularity with subitems
Now that we understand the big picture, let's focus on the finer details with lower-level action items. In the OKR world, additional tasks within each key result are often referred to as "initiatives" or "tactics".
To add an extra layer of granularity and to help understand what needs to be completed for each key result, check out subitems!
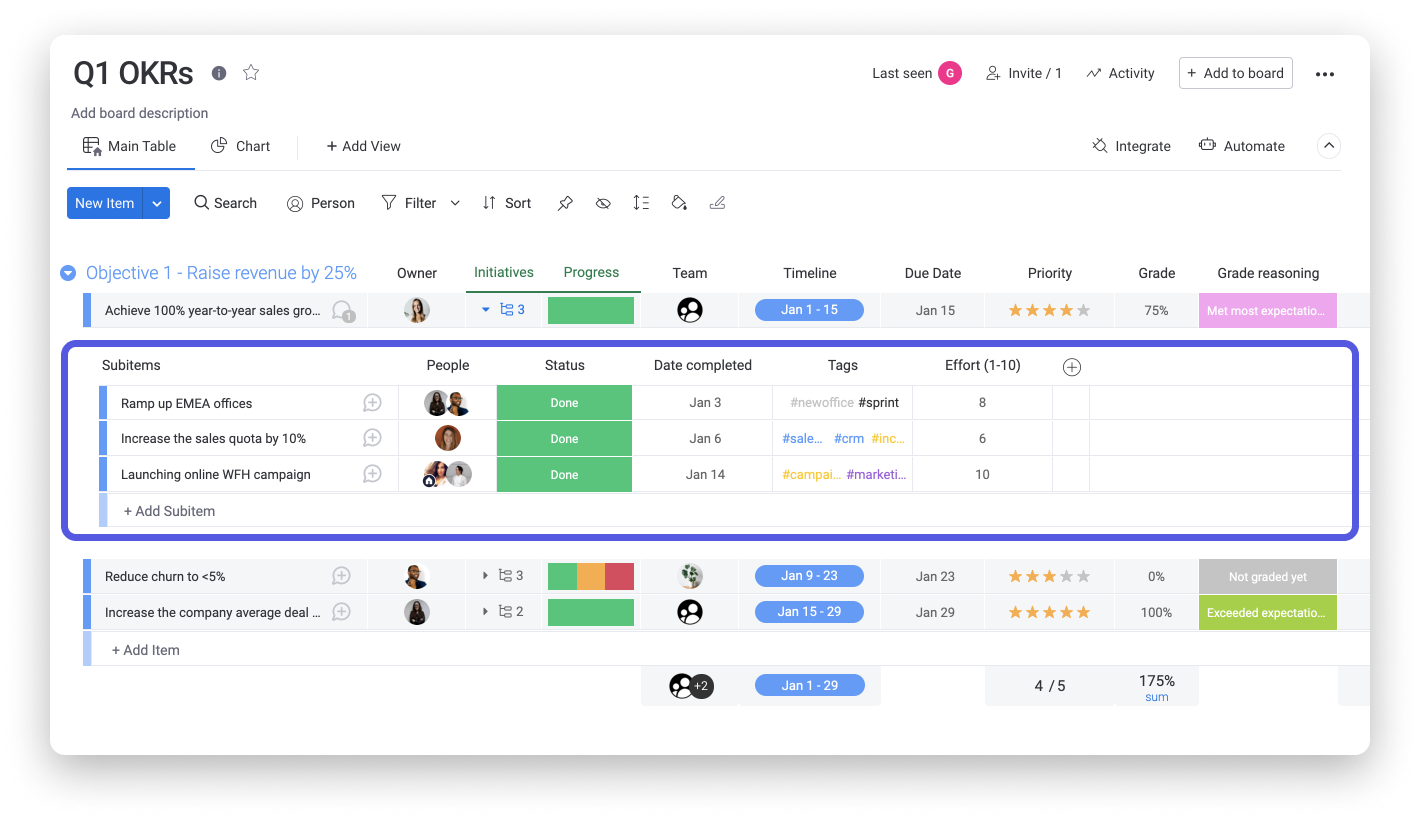
We utilize subitems to help provide tactical steps for our team to take in order to complete each key result. Furthermore, we added a few different column types here such as the Date, Tags, Numbers Column and more, to provide us with additional information.
Measure key results
Having regular syncs to review and grade completed results is a key factor of the OKR process. For our workflow, we utilized the Formula Column to automatically calculate and display each grade at a glance based off of the "Grade Reasoning" Status Column. Check out the formula below:
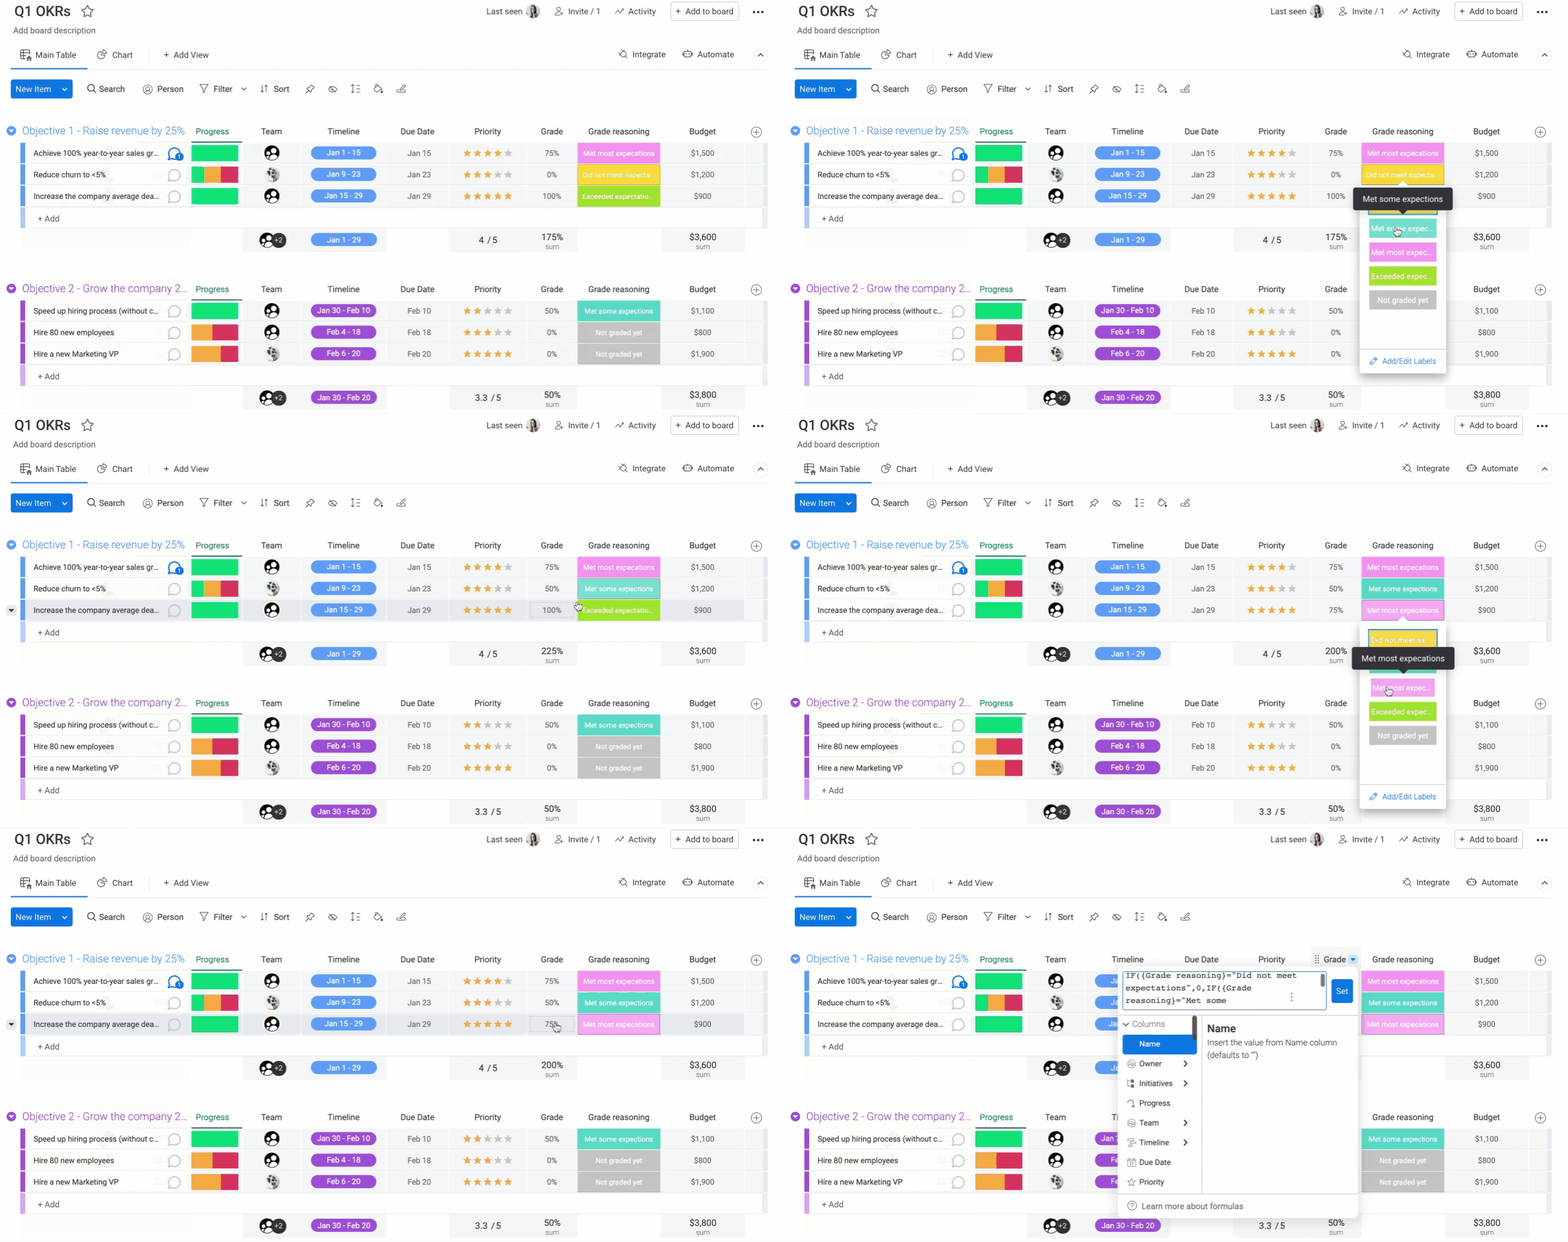
IF({Grade reasoning}="Did not meet expectations",0,IF({Grade reasoning}="Met some expectations",50,IF({Grade reasoning}="Met most expectations",75,IF({Grade reasoning}="Exceeded expectations",100,0))))
Furthermore, at every sync we made sure to use the Updates Section of each key result to provide further insight into the grade it was given.

Thanks to this setup, we successfully keep our sync summaries and grades in context of the key results they belong to. 🙌
Visually display OKR data
Once your OKR board is up and running, you may want to visualize information from the board to understand different angles of your data. For our workflow, we chose to set up the below stacked bar chart using the Chart View so we can easily see our objectives laid out as well as the ongoing progress.
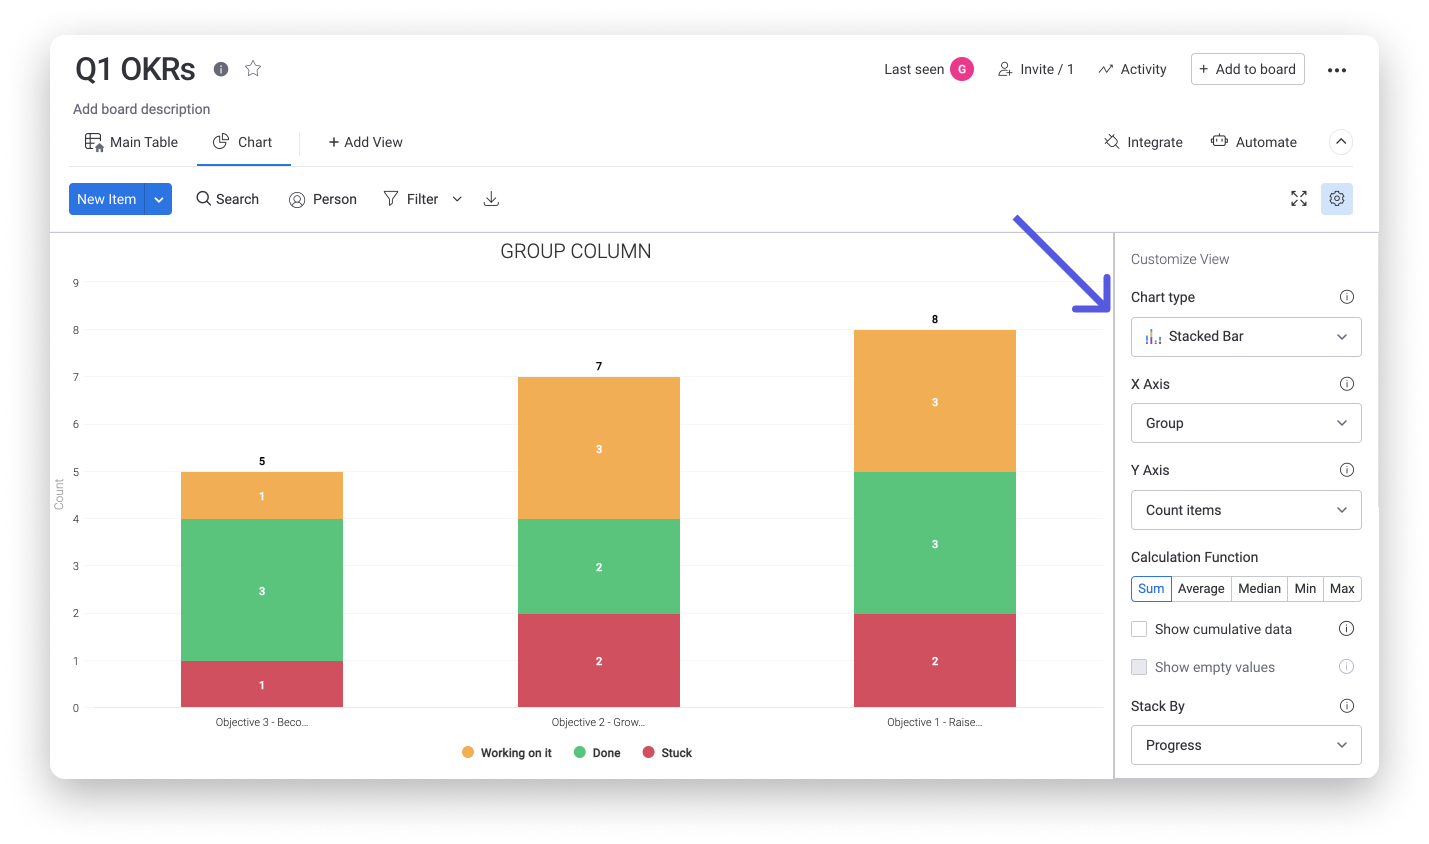
With this Chart View in place, we can analyze the progression of each quarterly objective, making it the perfect tool to use with our team during our weekly syncs!
Create OKR reports using dashboards
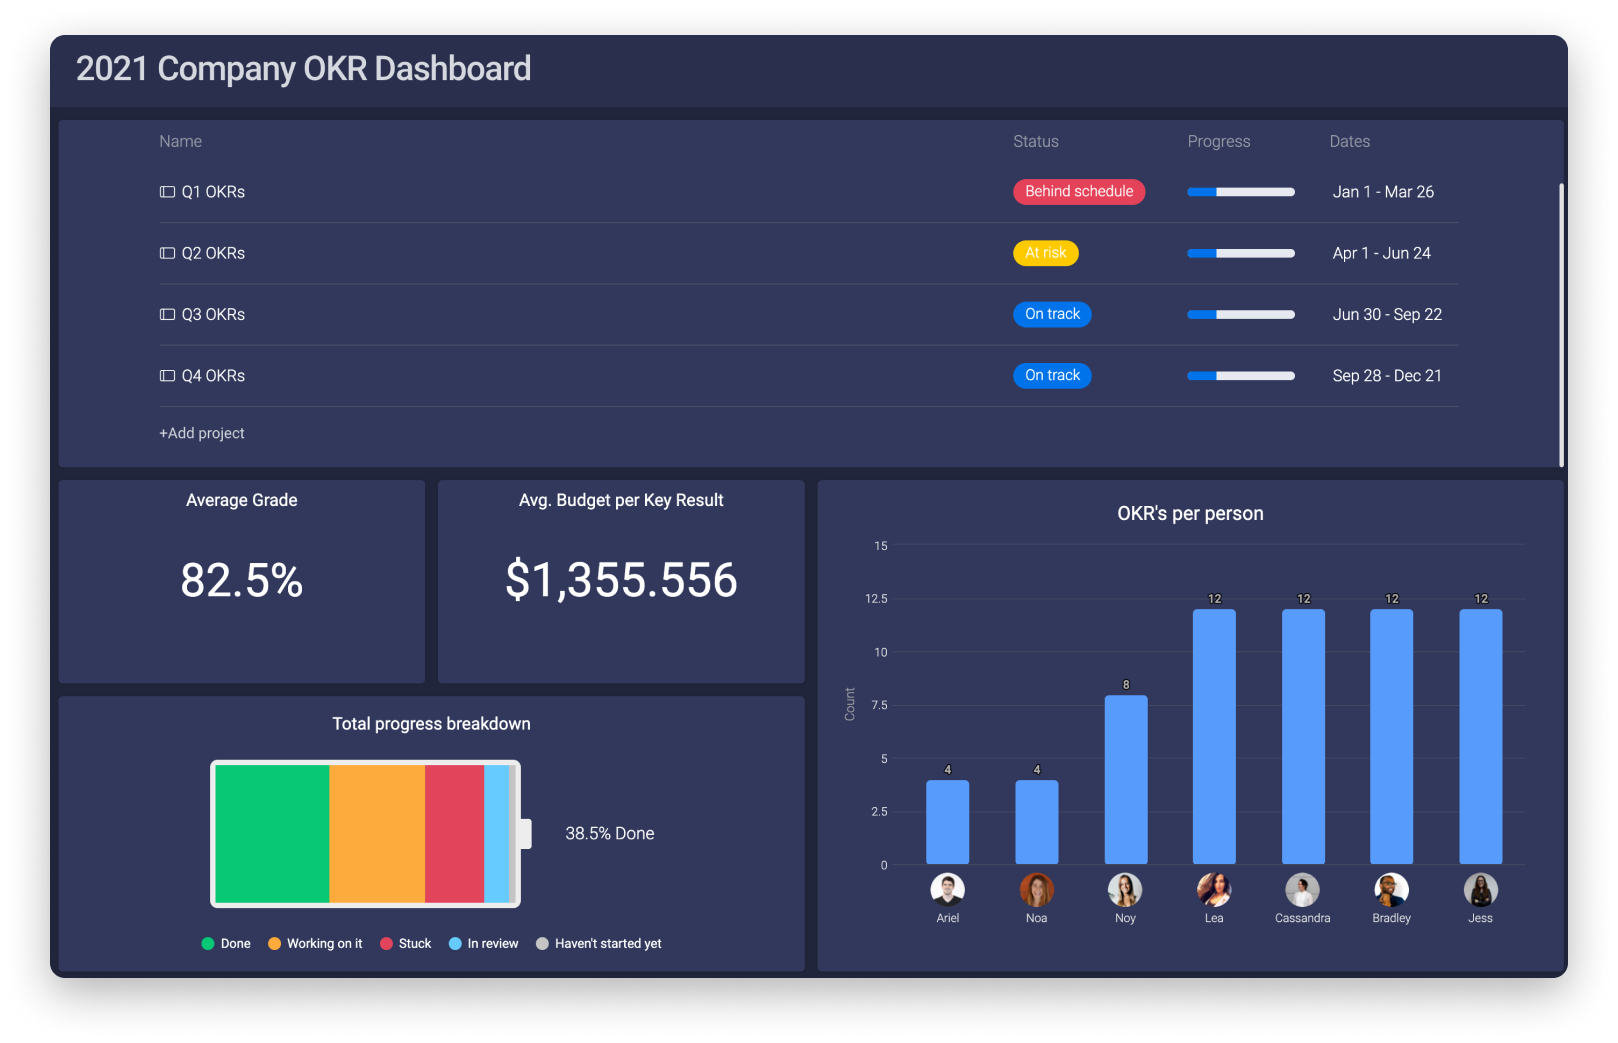
Finally, to aggregate OKR data from multiple boards into one visual overview, we put together the below Dashboard. This serves as a great tool to easily understand different metrics about our OKRs at a glance!
- The Overview Widget provides us with a quick understanding of where each of our quarterly OKRs stand
- The Numbers Widget shows us both the average grade of each completed OKR and the average budget for each key result
- The Battery Widget highlights the progress of all our OKRs together in one place
- The Chart Widget displays a breakdown of the number of OKRs that each employee is in charge of
Get creative!
These boards, views, dashboard widgets, and more are intended to be a starting point to help you get up and running with OKR management! You can use these exact suggestions if they're right for you, but be sure to experiment and test out all the amazing features on monday.com!
You can also customize your own automations, enable loads of integrations, and pull in data from multiple boards into high-level Dashboards to really connect the dots in your OKR processes.
If you have any questions, please reach out to our team right here. We’re available 24/7 and happy to help.
Comments