The GitHub Integration that you already know and love can be integrated into your monday dev workflows. But what if we told you that you could view real-time synced data from GitHub directly within your board? That's exactly what we want to present to you with the GitHub UI app!
What is GitHub UI?
GitHub UI is an app that can be added as a widget within your item card view to preview data from your GitHub repositories. You can customize the app to show all of your GitHub branches, commits, pull requests, and the CI/CD status for every one of your development tasks. It is synced with your GitHub account to show you only real-time data.
How to set it up
Open up the item card of any of the items on your board and click the "+" to add "Git UI" from the Item Views Center. The app will open up as a new "Git UI" tab. Now, simply click "Connect to GitHub".
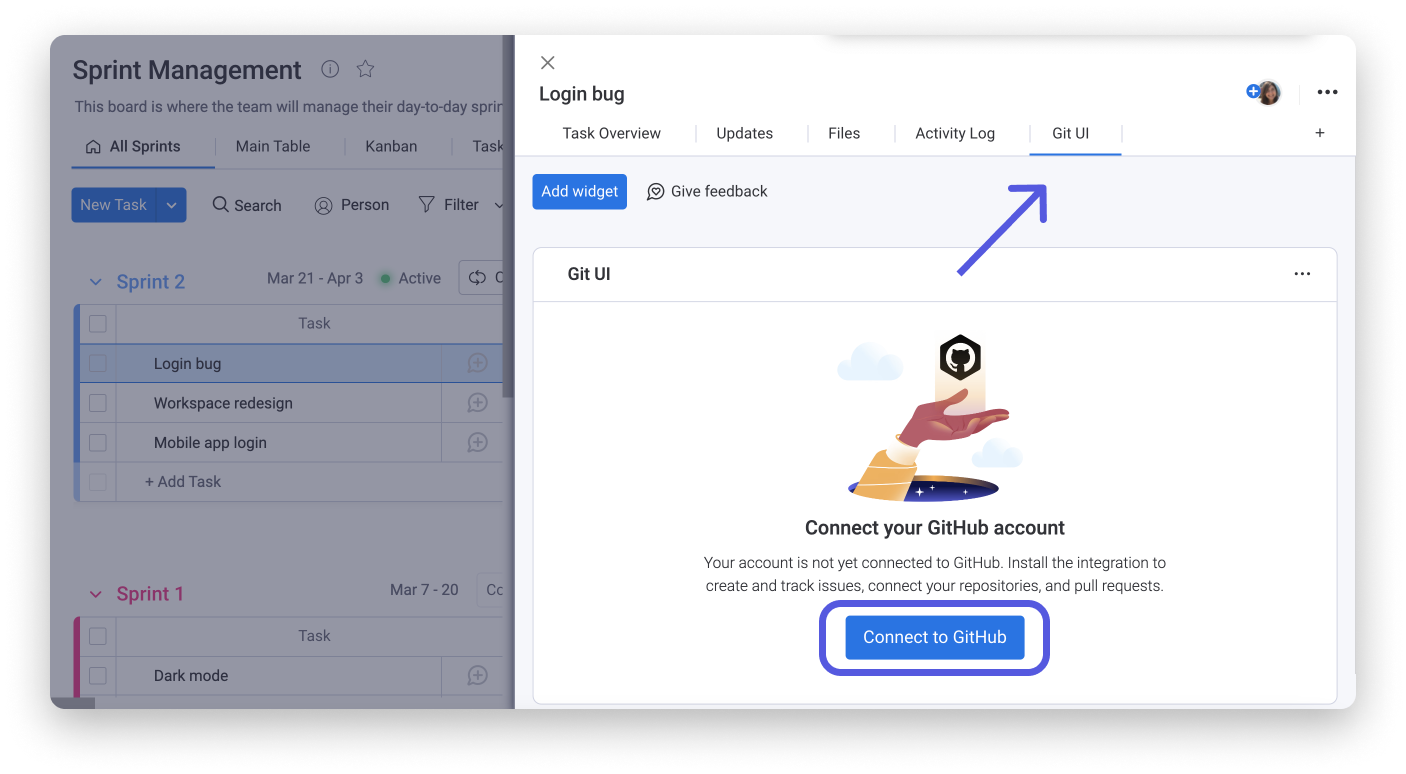
You'll be redirected to the GitHub page pictured below, where you can click "Install" to continue.
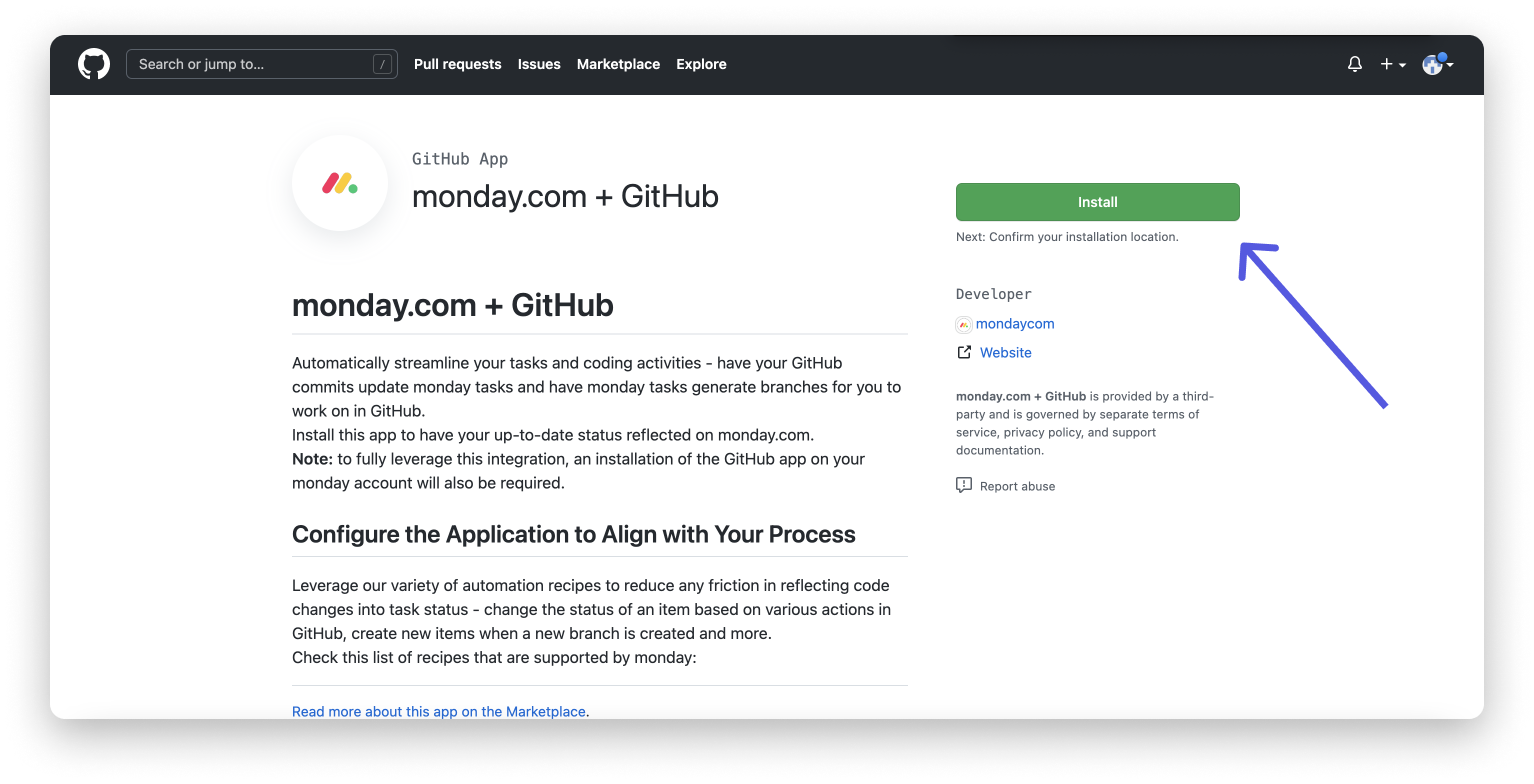
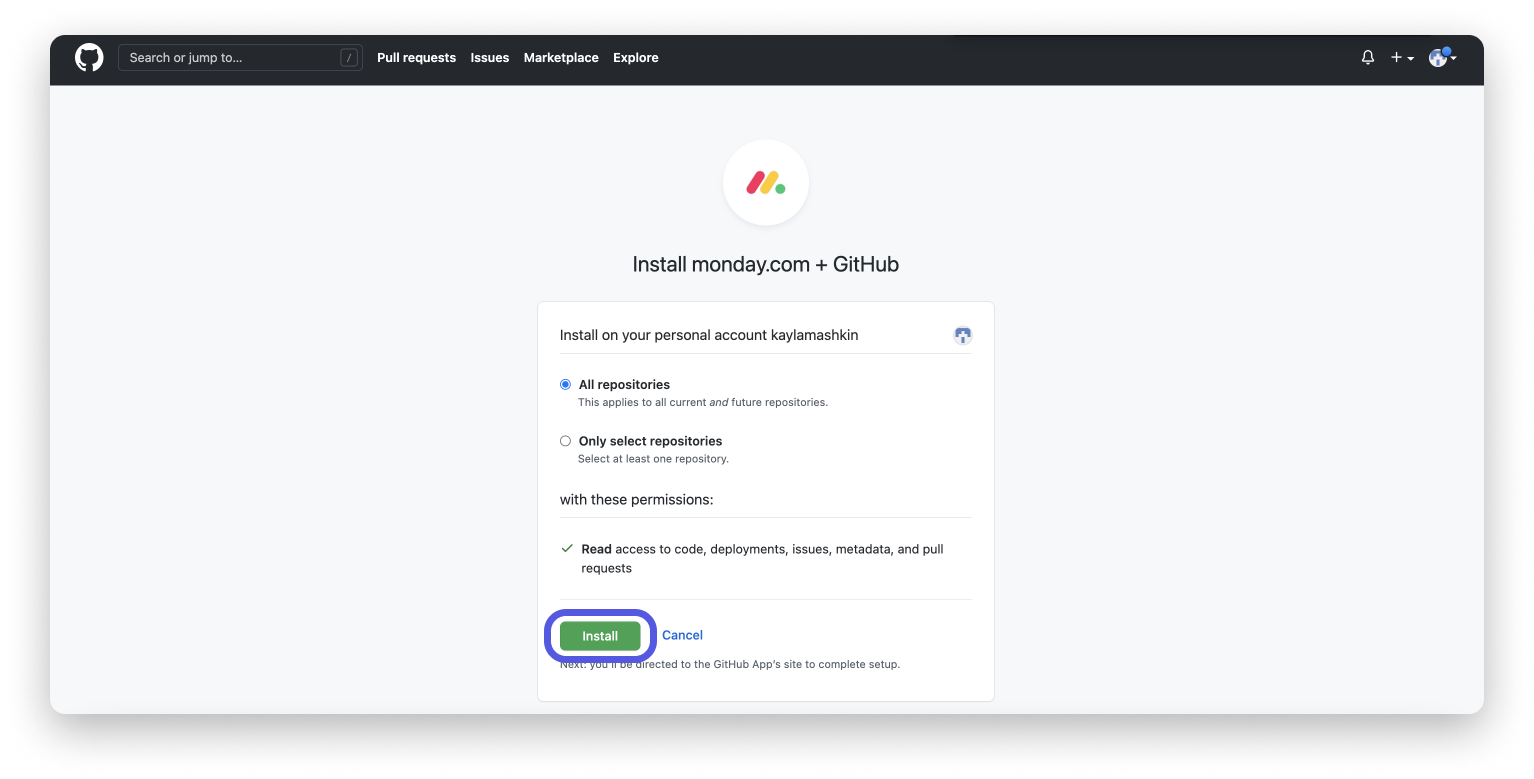
You are then given the option to sync all repositories or to select specific repositories and then click "Install" if you agree to the terms.
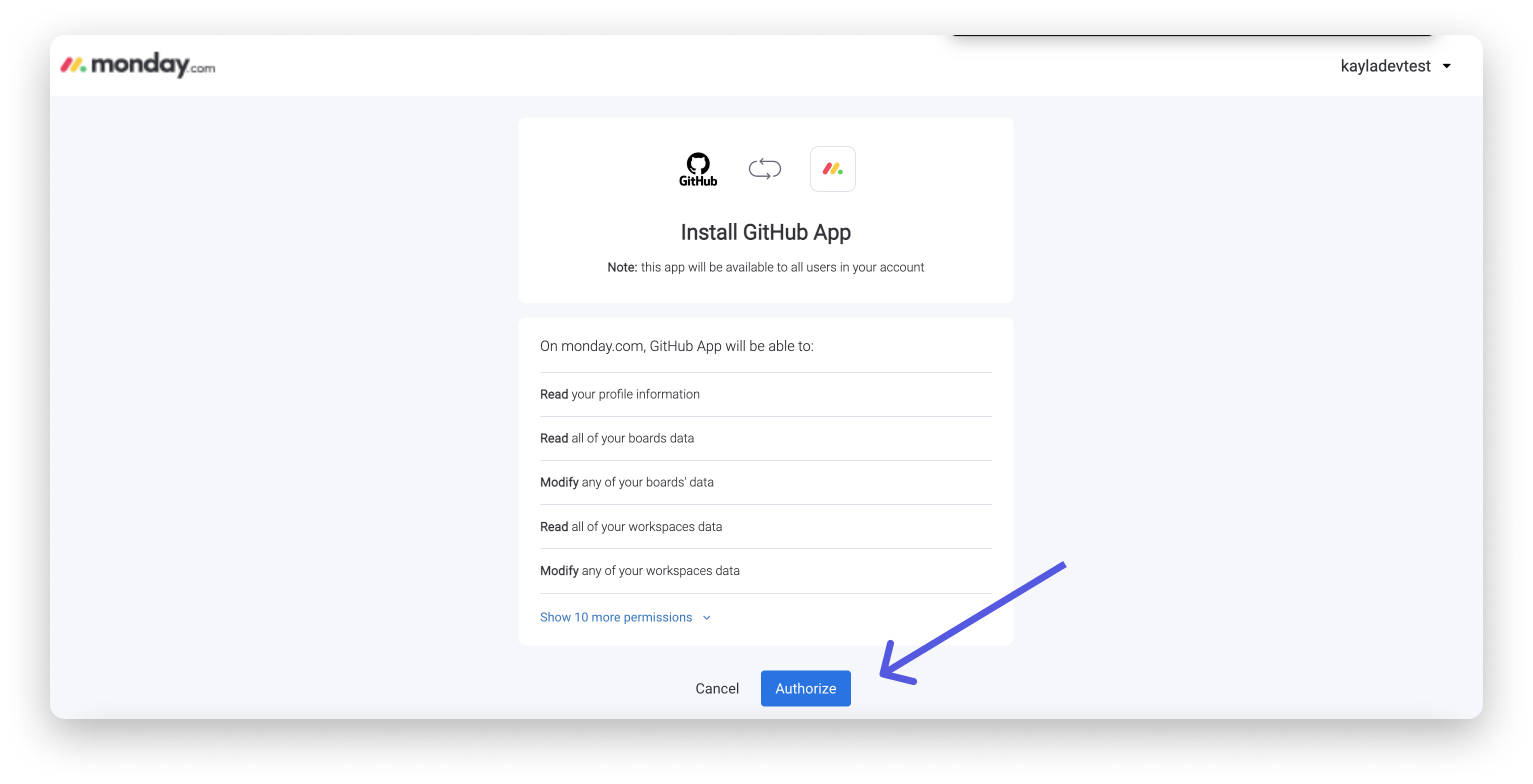
When you reach the following screen listing permissions, click "Authorize" to continue. Once again, we want you to note that monday.com will only have access to general account information and activity, but will never have access to read the data you upload to GitHub.
Click the "x" in the top-right corner of the pop-up screen to start using the app right in the item card where you started the flow!
How does it work?
Using the Item ID Column, you can connect the items on your board to issues and pull requests in GitHub. Let's take a look at how it works.
The Item ID Column will automatically assign a random ID number to each of the items or subitems in your board. You can copy this ID to your clipboard by simply clicking the number, as shown below.
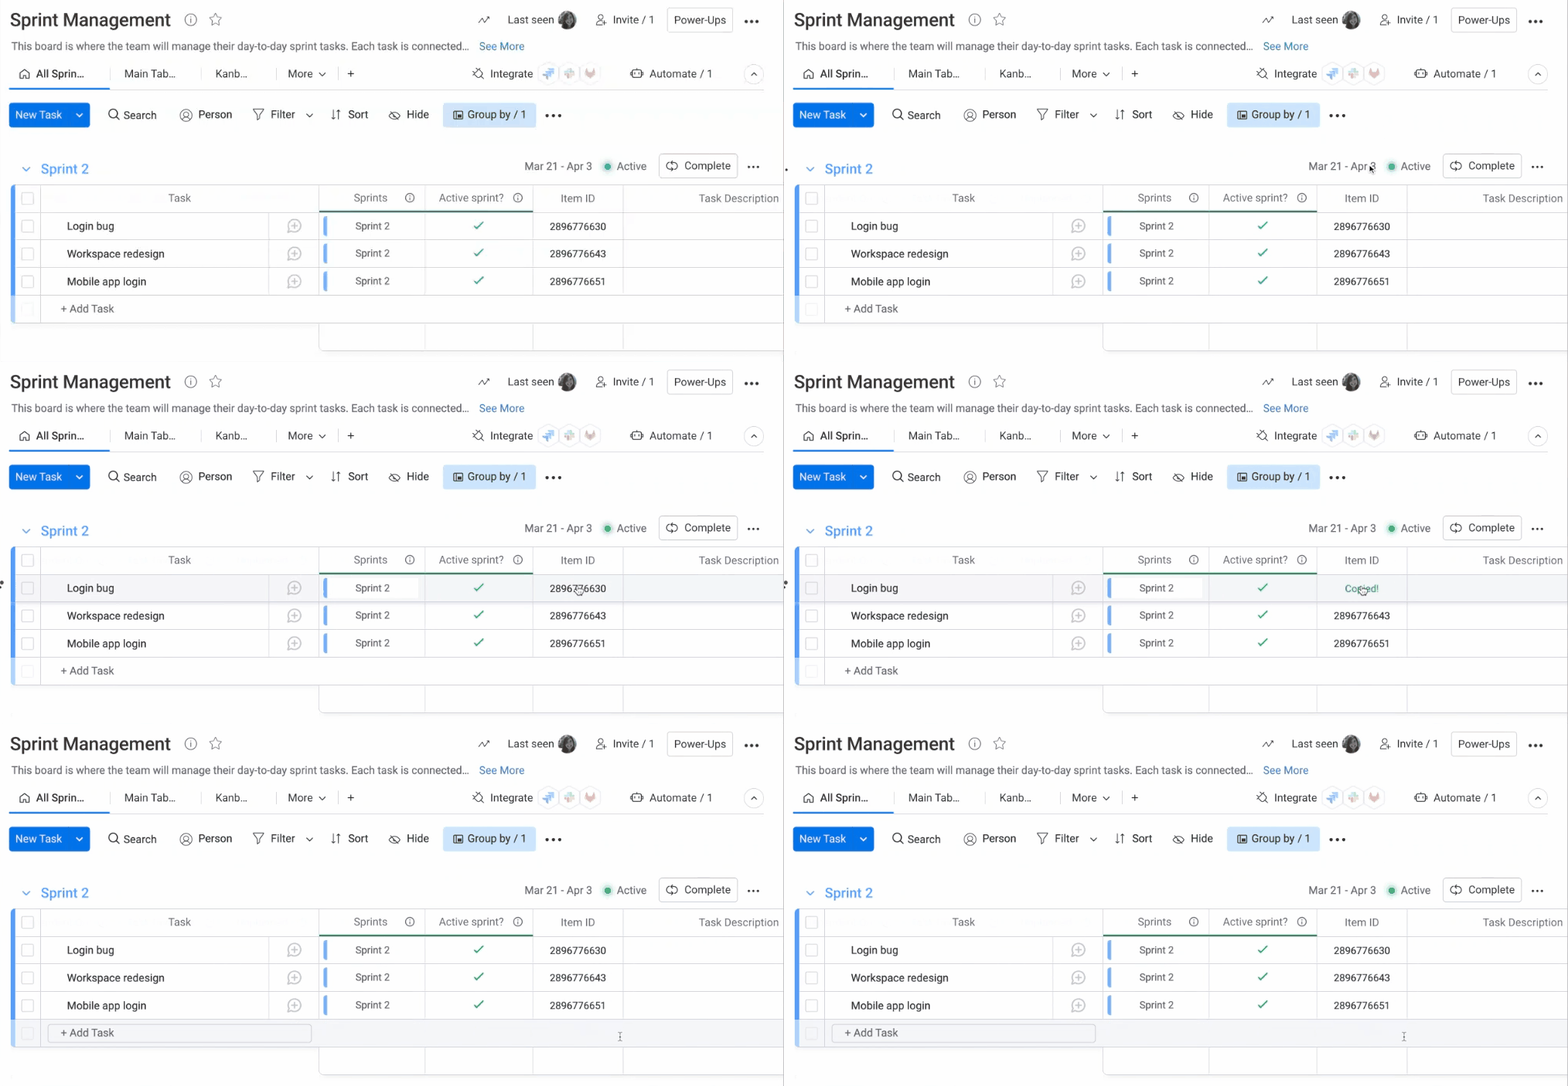
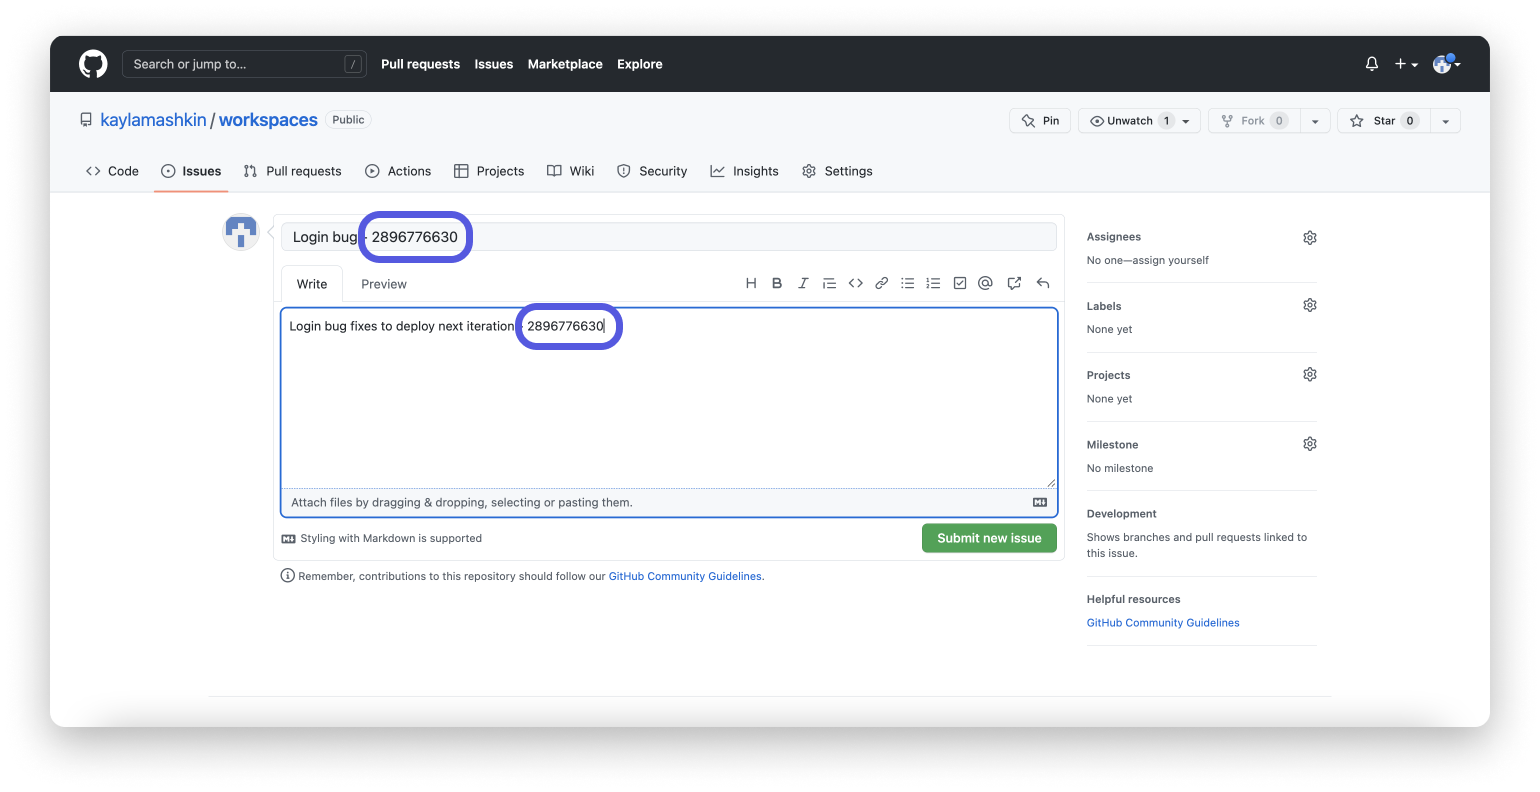
You can now paste the ID number into either the name or description of any pull request or issue. Using the ID number generated by monday.com will create the link between a pull request or issue in GitHub and the right monday.com item.
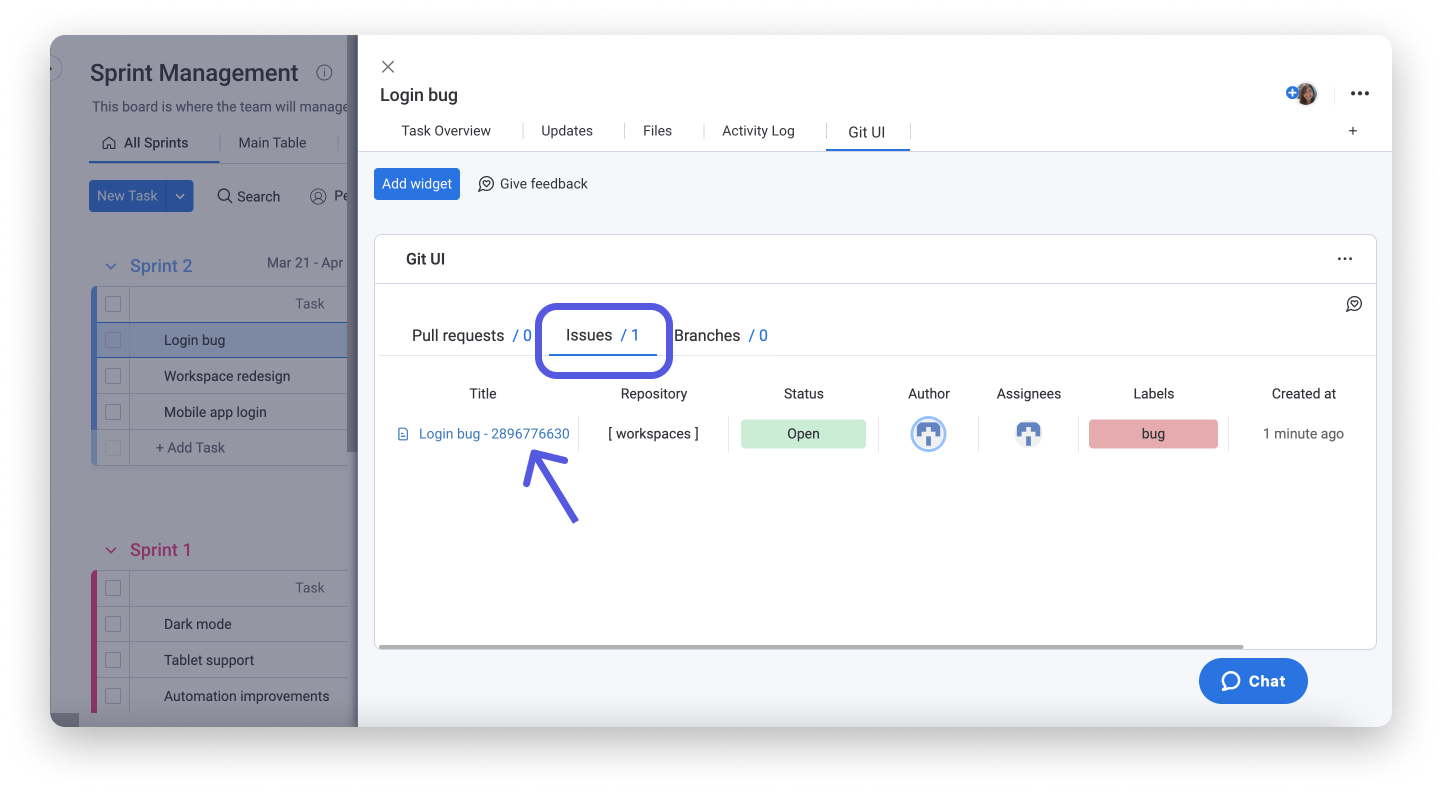
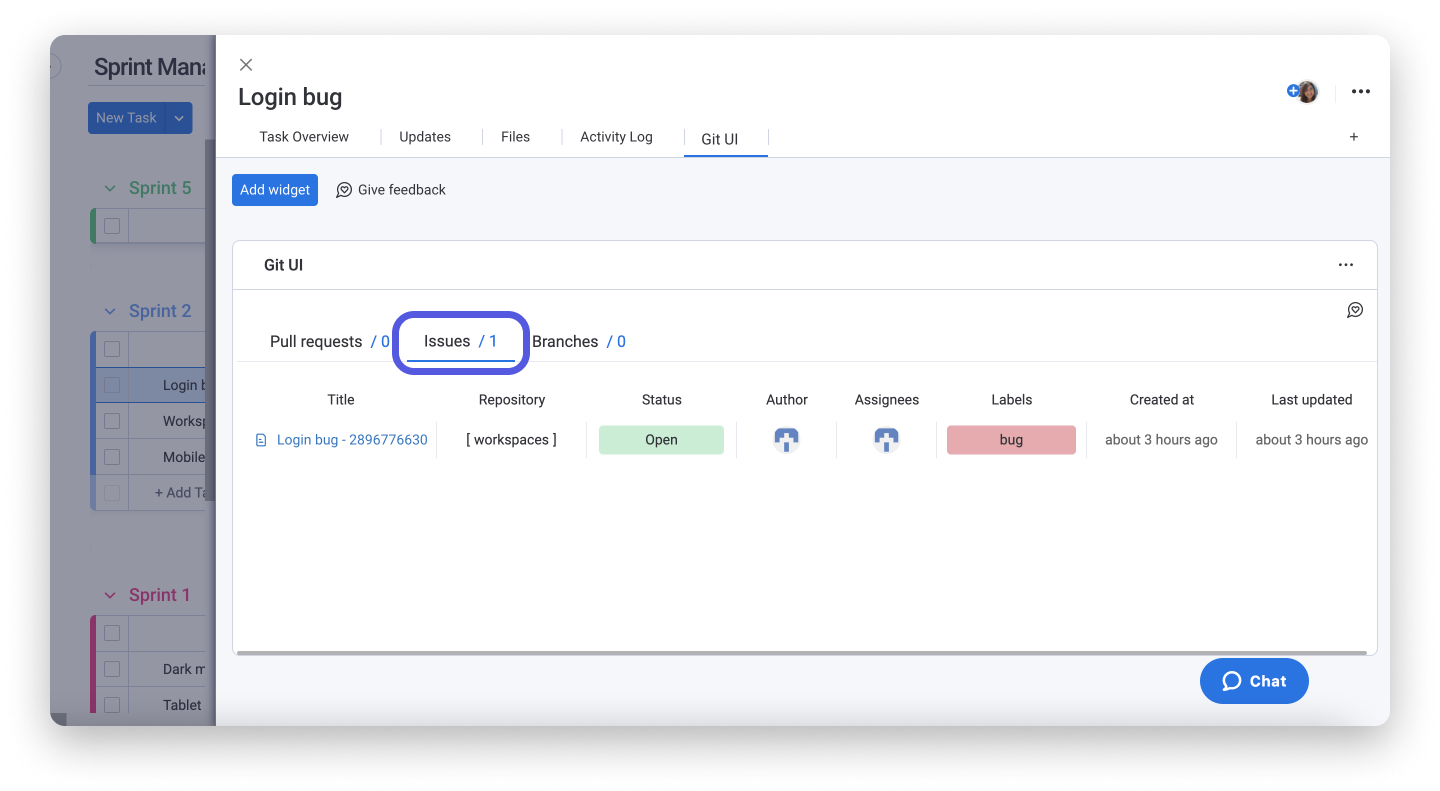
Now you can see the issue you created under the "Issues" tab in the relevant item card.
What information is displayed?
The data displayed in the GitHub UI app is categorized into 3 tabs; Pull requests, Issues, and Branches.
Pull requests
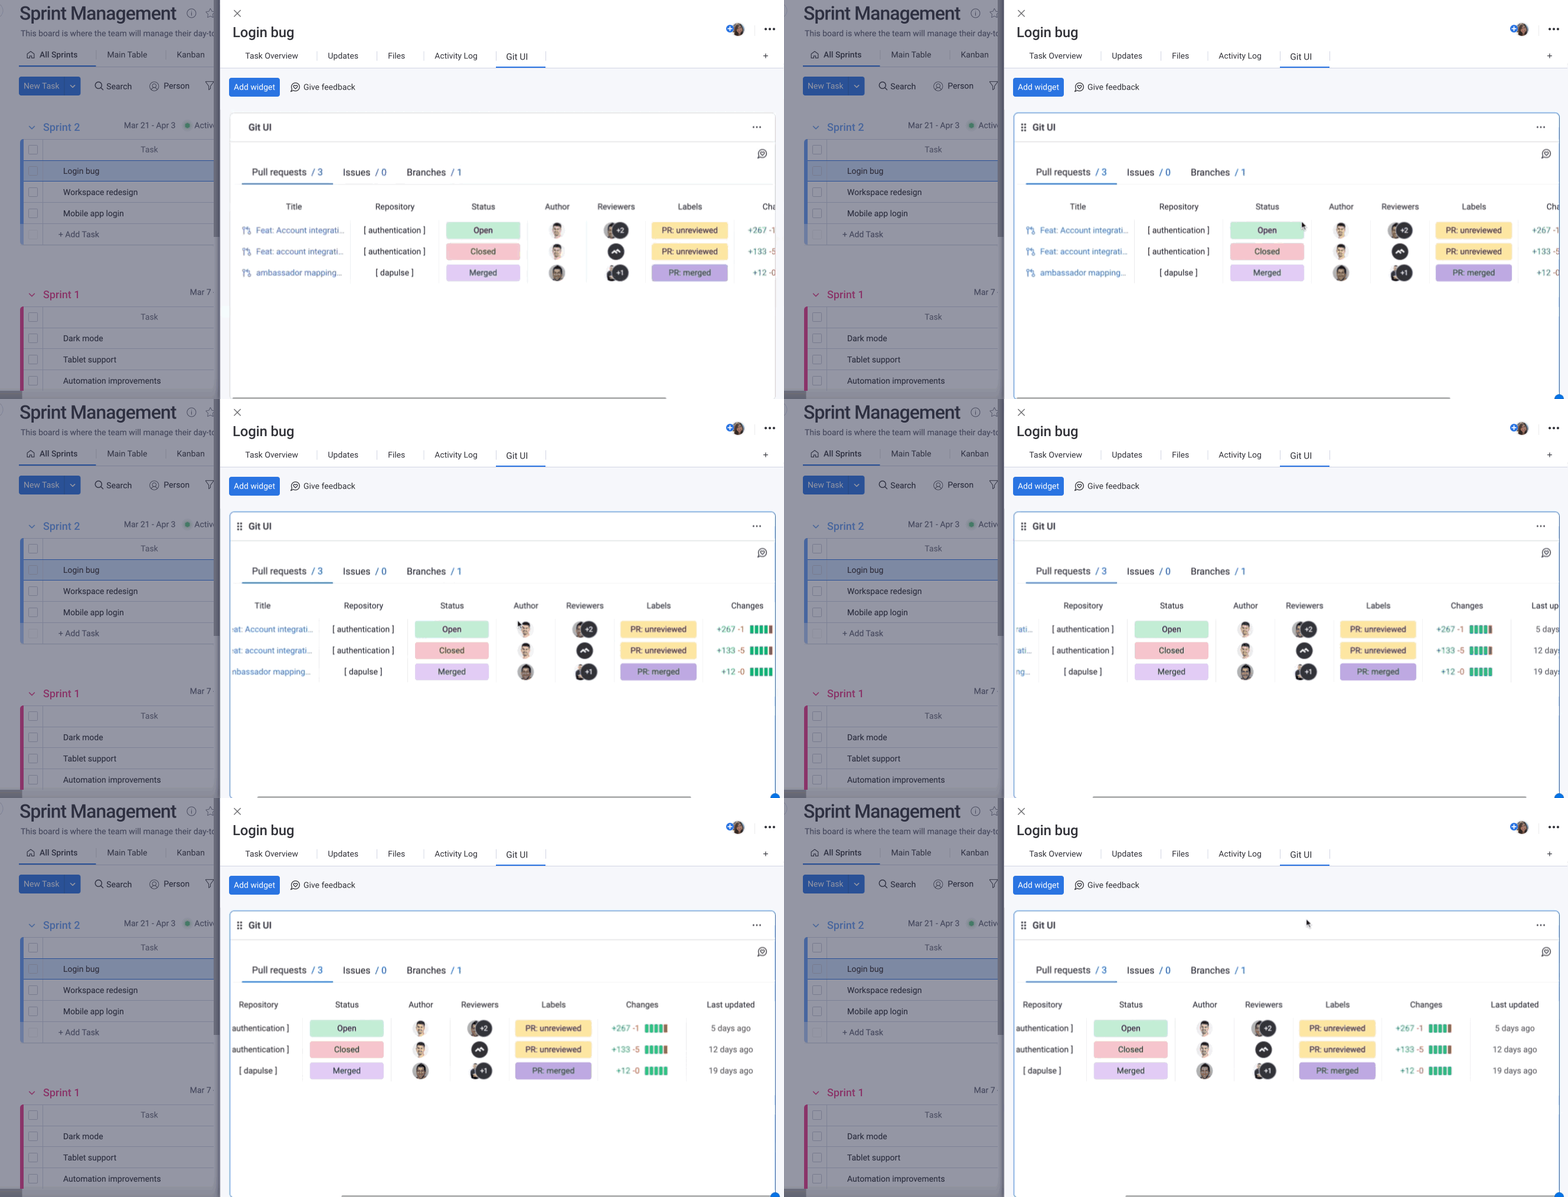
The "Pull requests" tab lists each pull request in the style of a monday.com item. Though you can't interact with the columns, all of the important information is visible. The requests are listed vertically and the relevant information is listed horizontally under the following "columns":
Issues
The "Issues" tab lists all issues that have been labeled with the same item ID. They are structured like items just as the pull requests are, and are organized by the following columns:
Branches
The "Branches" tab shows all of the branches related to any given item in your board. They are organized into the following columns:
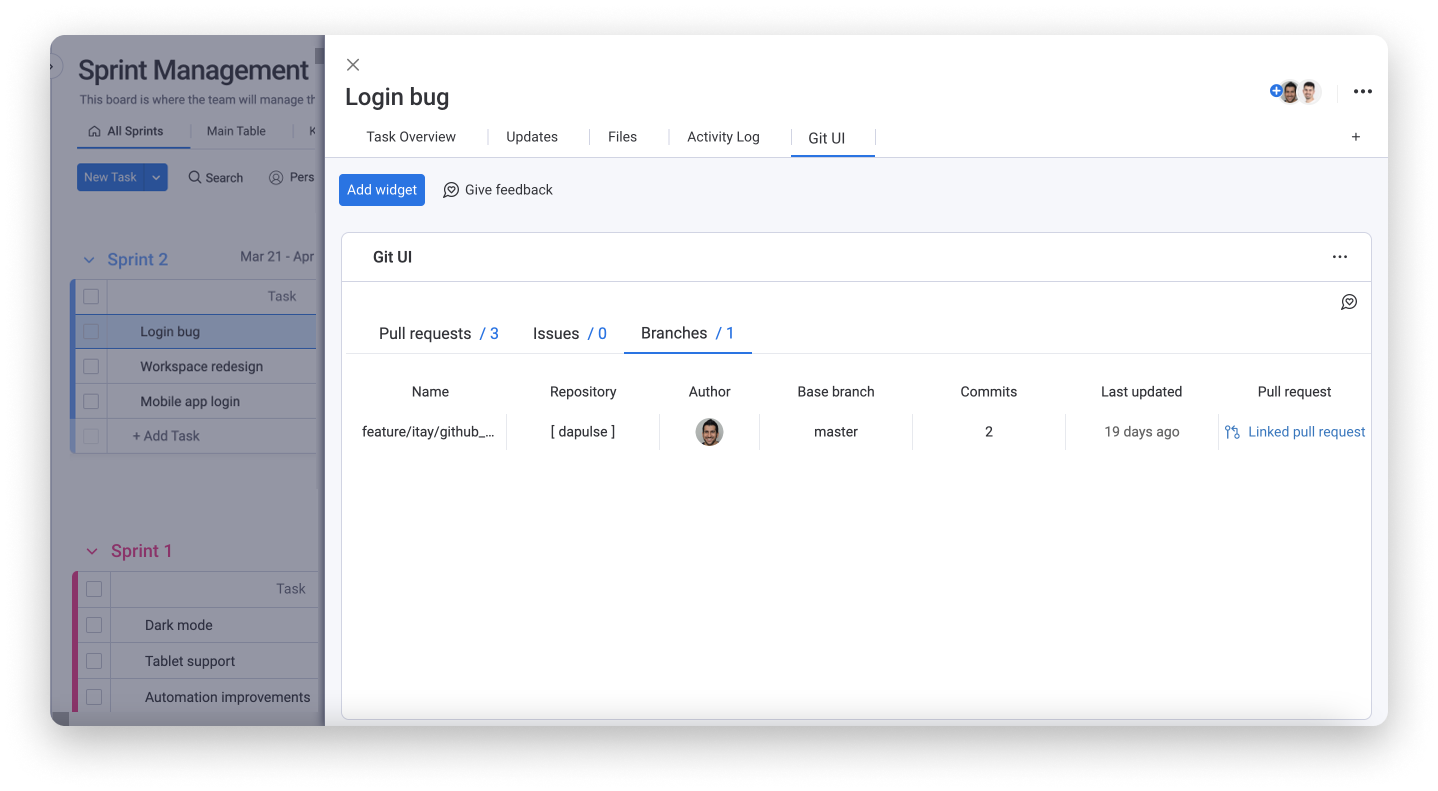
We've included a script that automatically creates a branch connected to your item, meaning you don't have to manually input your item ID to connect the two.
Summarize your data
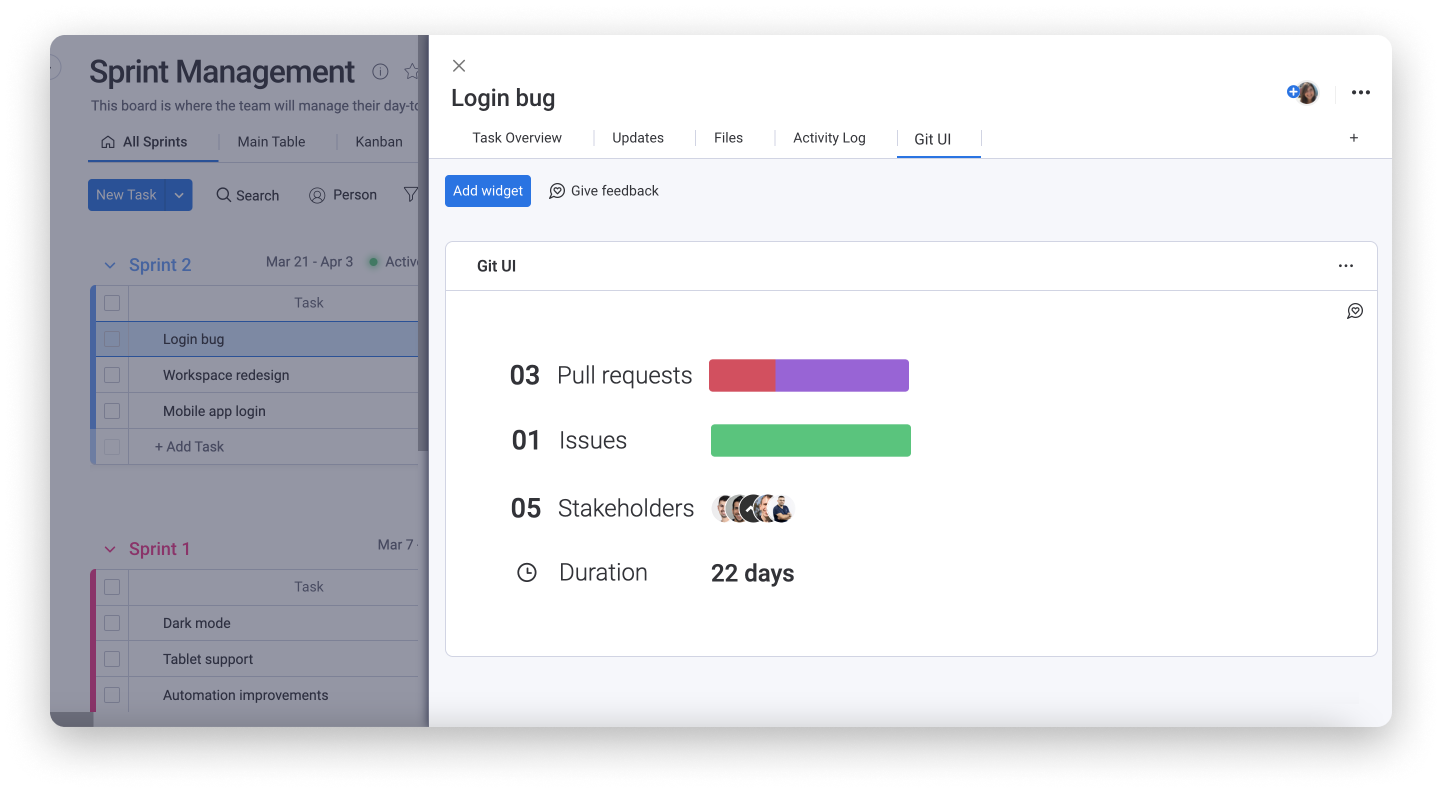
While the itemized list of all of your issues, pull requests, and branches gives you specific details, the "Summary" view will show you a visual breakdown of the aggregated data in your GitHub app!
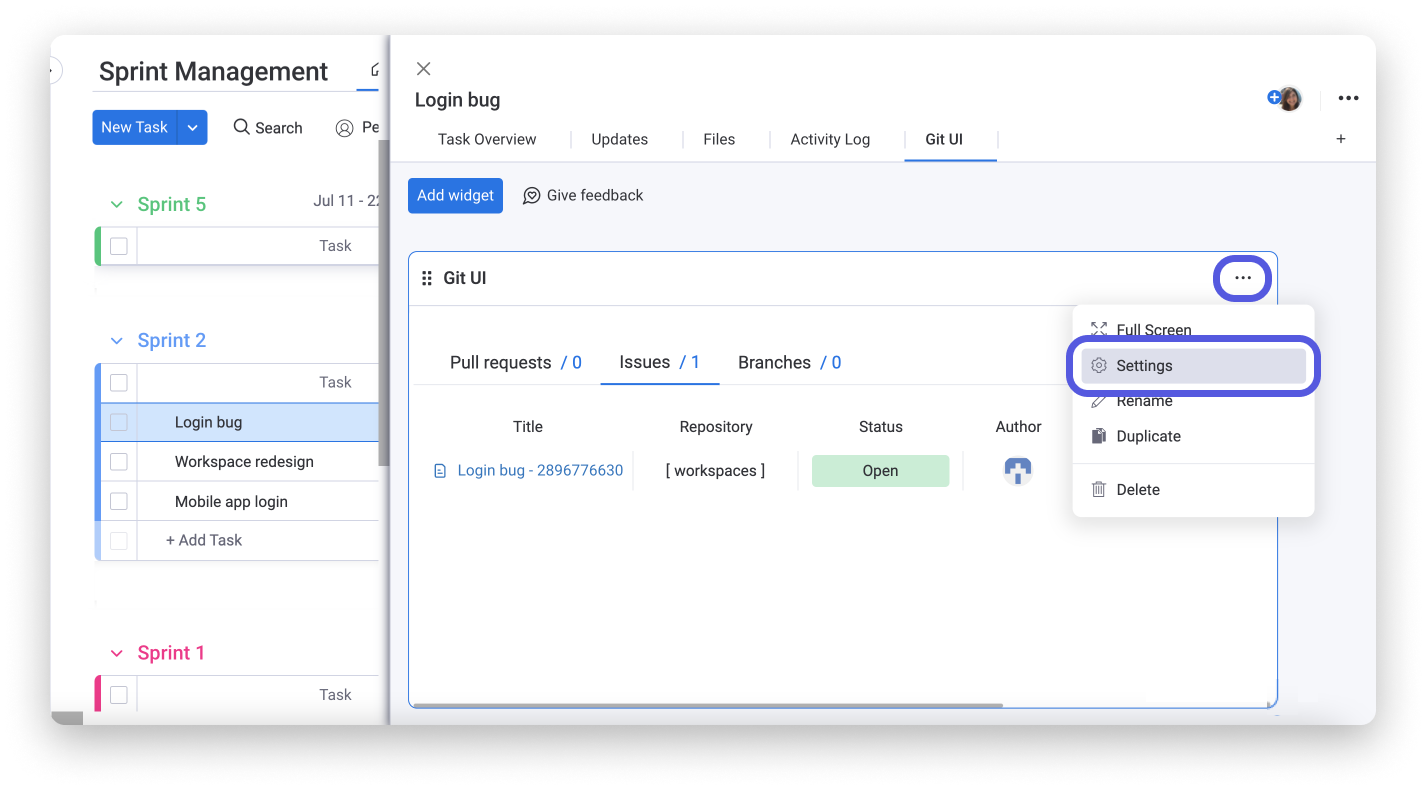
To show your app's summary, click the 3-dot menu at the top right corner of your app and then click "Settings", as shown below.
Now you can see all of your data organized into:
- Pull requests - the number of requests and a battery-style representation of their statuses
- Issues - the number of issues and a battery-style representation of their statuses
- Stakeholders - the number of stakeholders and their monday.com profile pictures
- Duration - the total amount of time all of this data has been open for
If you have any questions, please reach out to our team right here. We’re available 24/7 and happy to help.
Comments