
 Leestijd: 5 minuten
 Functie
Resource management is het proces om het gebruik van je resources en de toewijzing daarvan te plannen. Resources kunnen alles zijn wat je bedrijf nodig heeft om effectief te werken — werknemers, apparatuur of zelfs je merkactiva. Wat je resources ook zijn, monday.com is er om je te helpen je bedrijf op de rails te houden!
Voordat je begint
Zorg er, om de werklast van je teamleden te meten, voor dat je borden de volgende kolommen bevatten:
- Een mensenkolom
- Een datum of een tijdlijnkolom
- Optioneel - Een nummer- of formulekolom om de vereiste inspanning voor elke taak aan te geven; bijv. 1 uur, 6 uren
Als alternatief kun je, als je andere bronnen wilt meten, zoals vergaderruimten, fabrieksmachines, handgereedschap, camera's (noem maar op), een statuskolom gebruiken!
Een andere belangrijke instelling om rekening mee te houden is het weekend. Je kunt de weekenden als werkdagen laten meetellen, of ze er van uitsluiten. Je kunt deze instelling aanpassen in het beheerdersgedeelte van je account. Bekijk dit artikel voor meer informatie.
Hoe voeg je deze weergave toe aan je bord
Om de werklastweergave aan je bord toe te voegen, klik je op de ![]() optie bovenaan je bord (als je daarover beweegt, staat er "Voeg weergave toe"). Selecteer "Meer weergaven" en zoek naar "Werklast" in het Weergavecentrum:
optie bovenaan je bord (als je daarover beweegt, staat er "Voeg weergave toe"). Selecteer "Meer weergaven" en zoek naar "Werklast" in het Weergavecentrum:
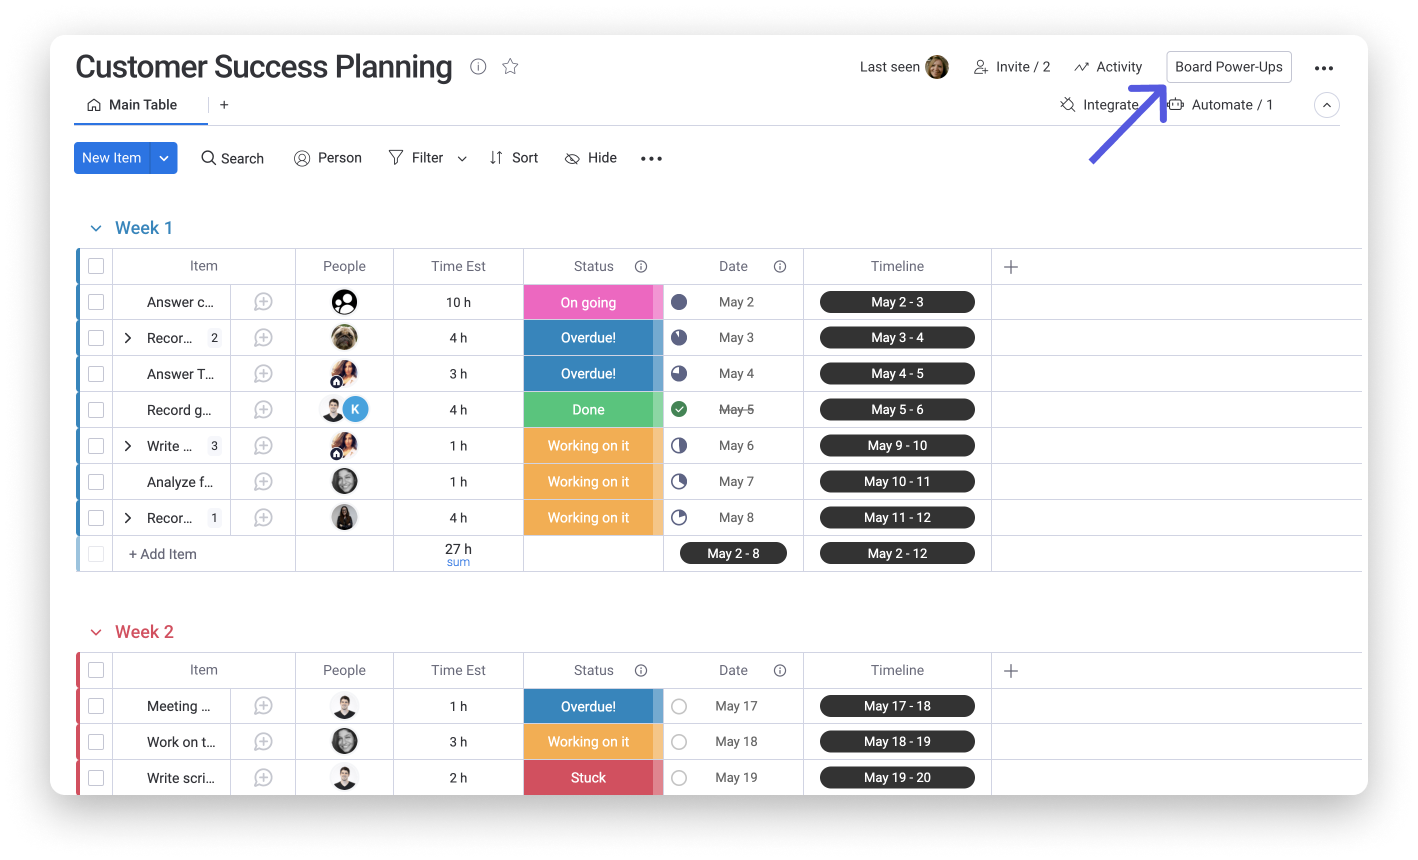
Je kunt ook een nieuw bord toevoegen door op "Bord Power-ups" te klikken in de rechter bovenhoek van je scherm. Selecteer "Bordweergaven" en kies "Werklast" in het Weergavecentrum:
Hoe je de widget aan je dashboard toevoegt
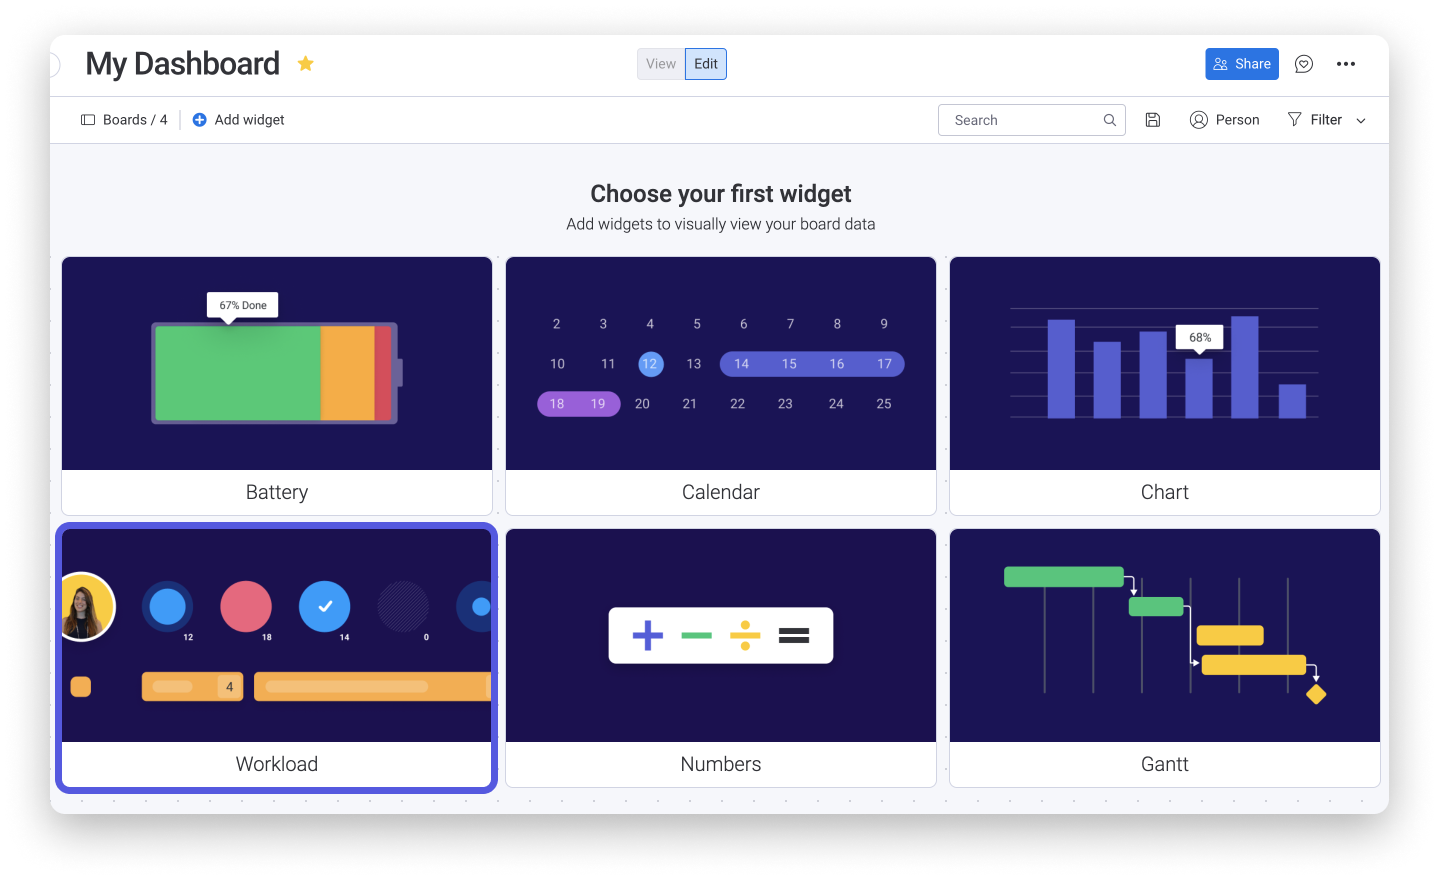
Om de Werklastweergave widget aan je dashboard of dashboardweergave toe te voegen, klik je op "+ Widget toevoegen" en selecteer je "Werklast":
De weergave instellen
Stap 1 - Bouw het bord
Laten we zeggen dat we ons klantsuccesteam willen beheren. Op ons bord hebben we:
- Een mensenkolom om elke taak toe te wijzen aan een of meer teamleden
- Een tijdlijn of datumkolom om het tijdsbestek van de taak te definiëren
- Optioneel - Een nummerskolom die we gebruiken als een schatting van de tijd voor elke taak.
Stap 2 - Kies de tijdkolom
Aangezien deze weergave alle items controleert die aan een persoon zijn toegewezen gedurende een bepaalde periode, moet je bord een datum- of tijdlijnkolom hebben.
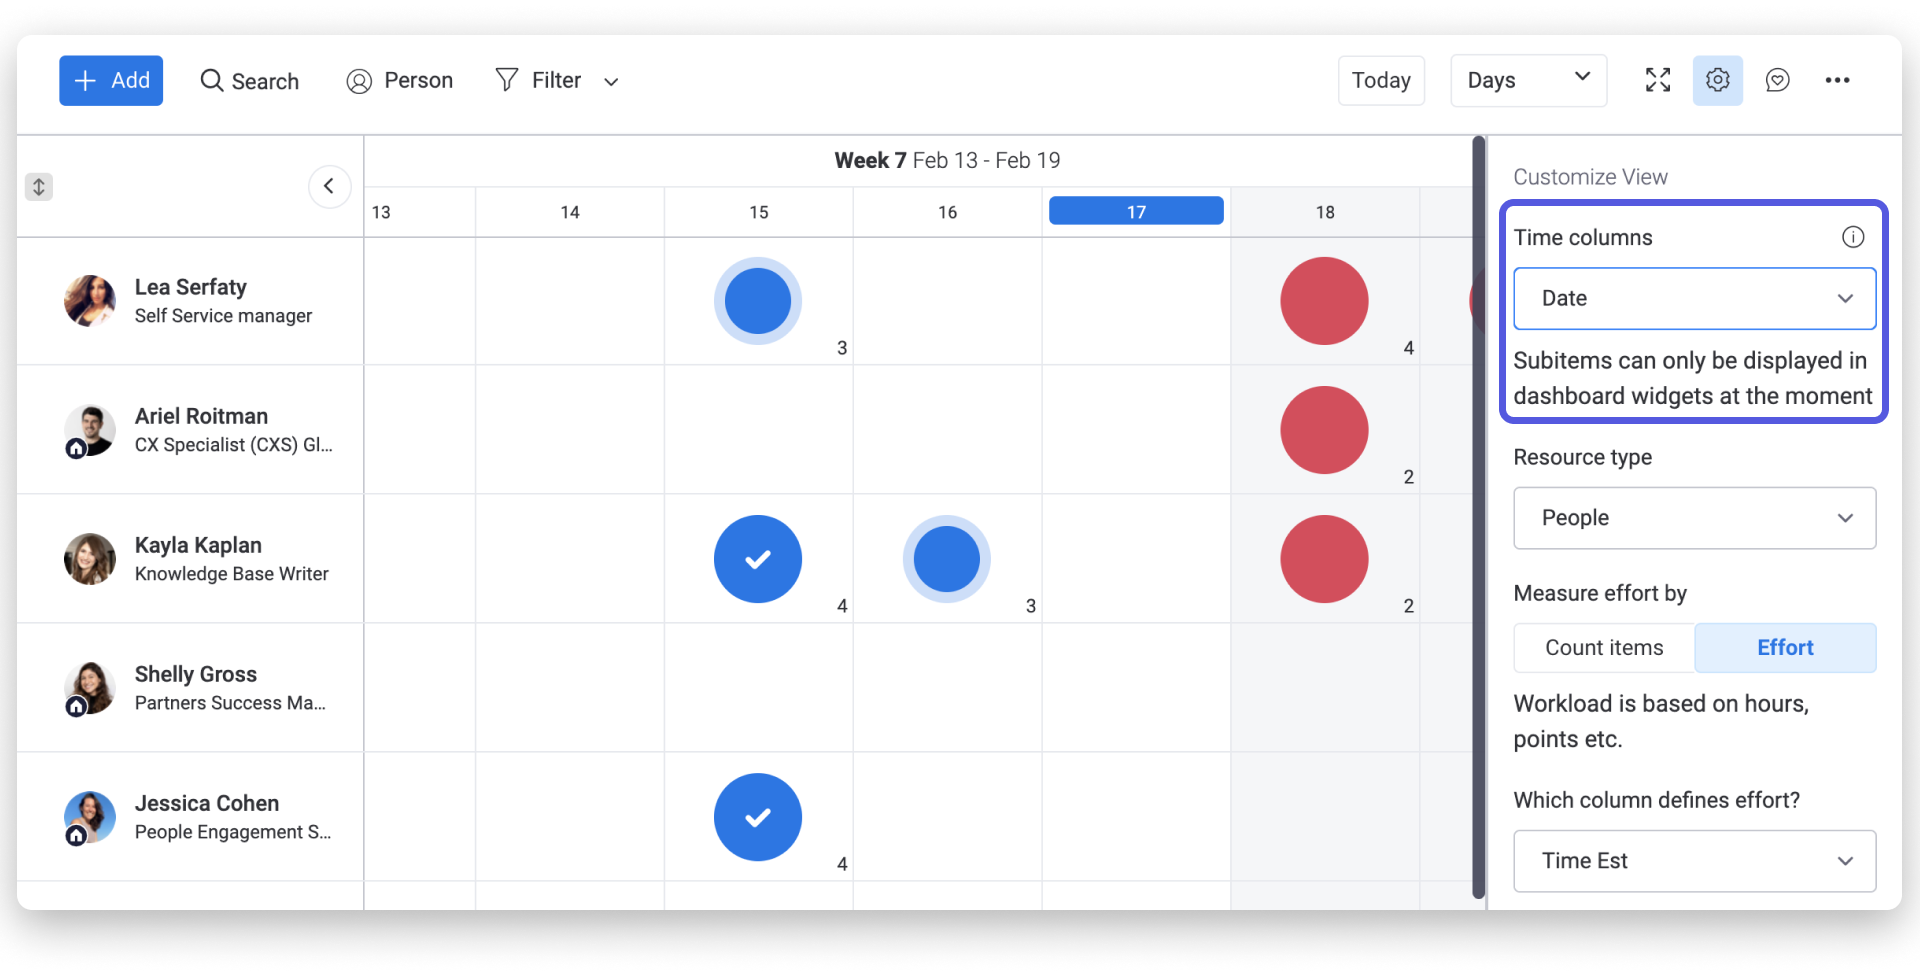
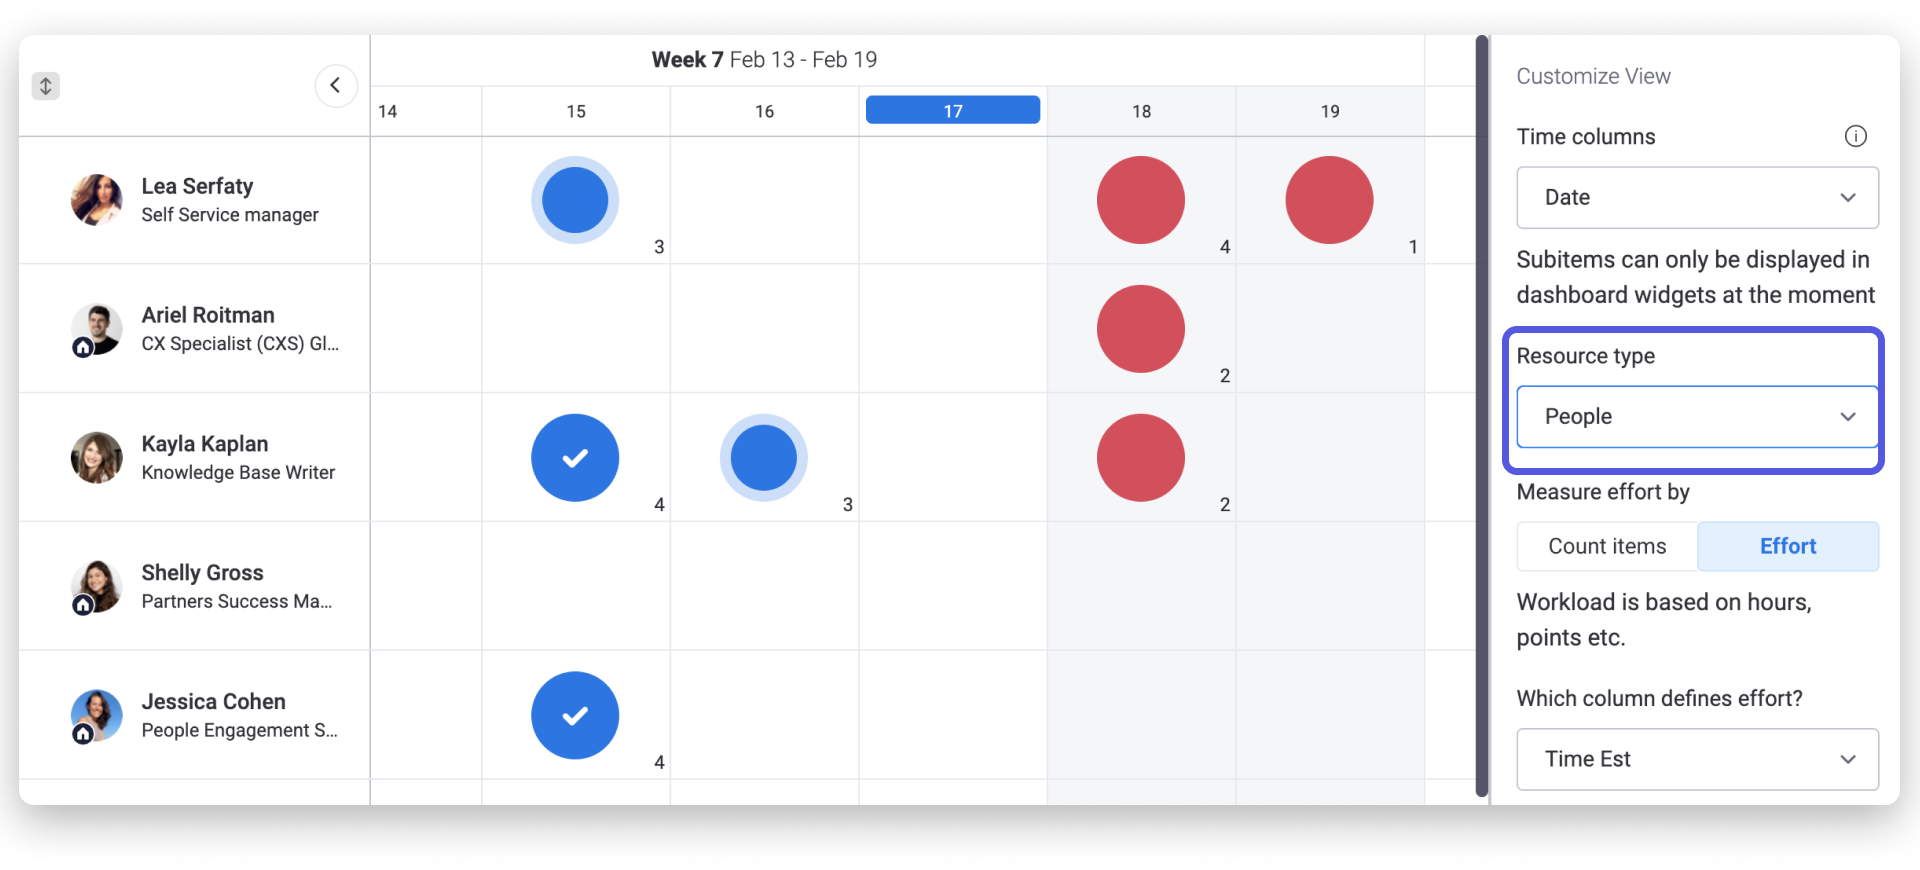
Stap 3 - Kies het type middel
Nu moet je kiezen welk type middel je op de werklast wilt vertegenwoordigen. Het type bron kan een mensenkolom, statuskolom of groep zijn. Dit bepaalt volgens welke parameters we de werklast verdeeld zien.
Stap 4 - Meet de inzet
Je kunt de data op twee manieren weergeven: tel item en inzet.
- Tel item
Als je voor items tellen kiest zal ieder item dat aan deze persoon is toegewezen tellen als 1 en worden weergegeven op het bord.
- Inzet
Soms vergen sommige van onze taken wat meer inzet, of zijn ze belangrijker voor het project. In ons geval gebruiken we de tijdschatting kolom. Die instelling werkt met zowel een nummer- als formule kolom.
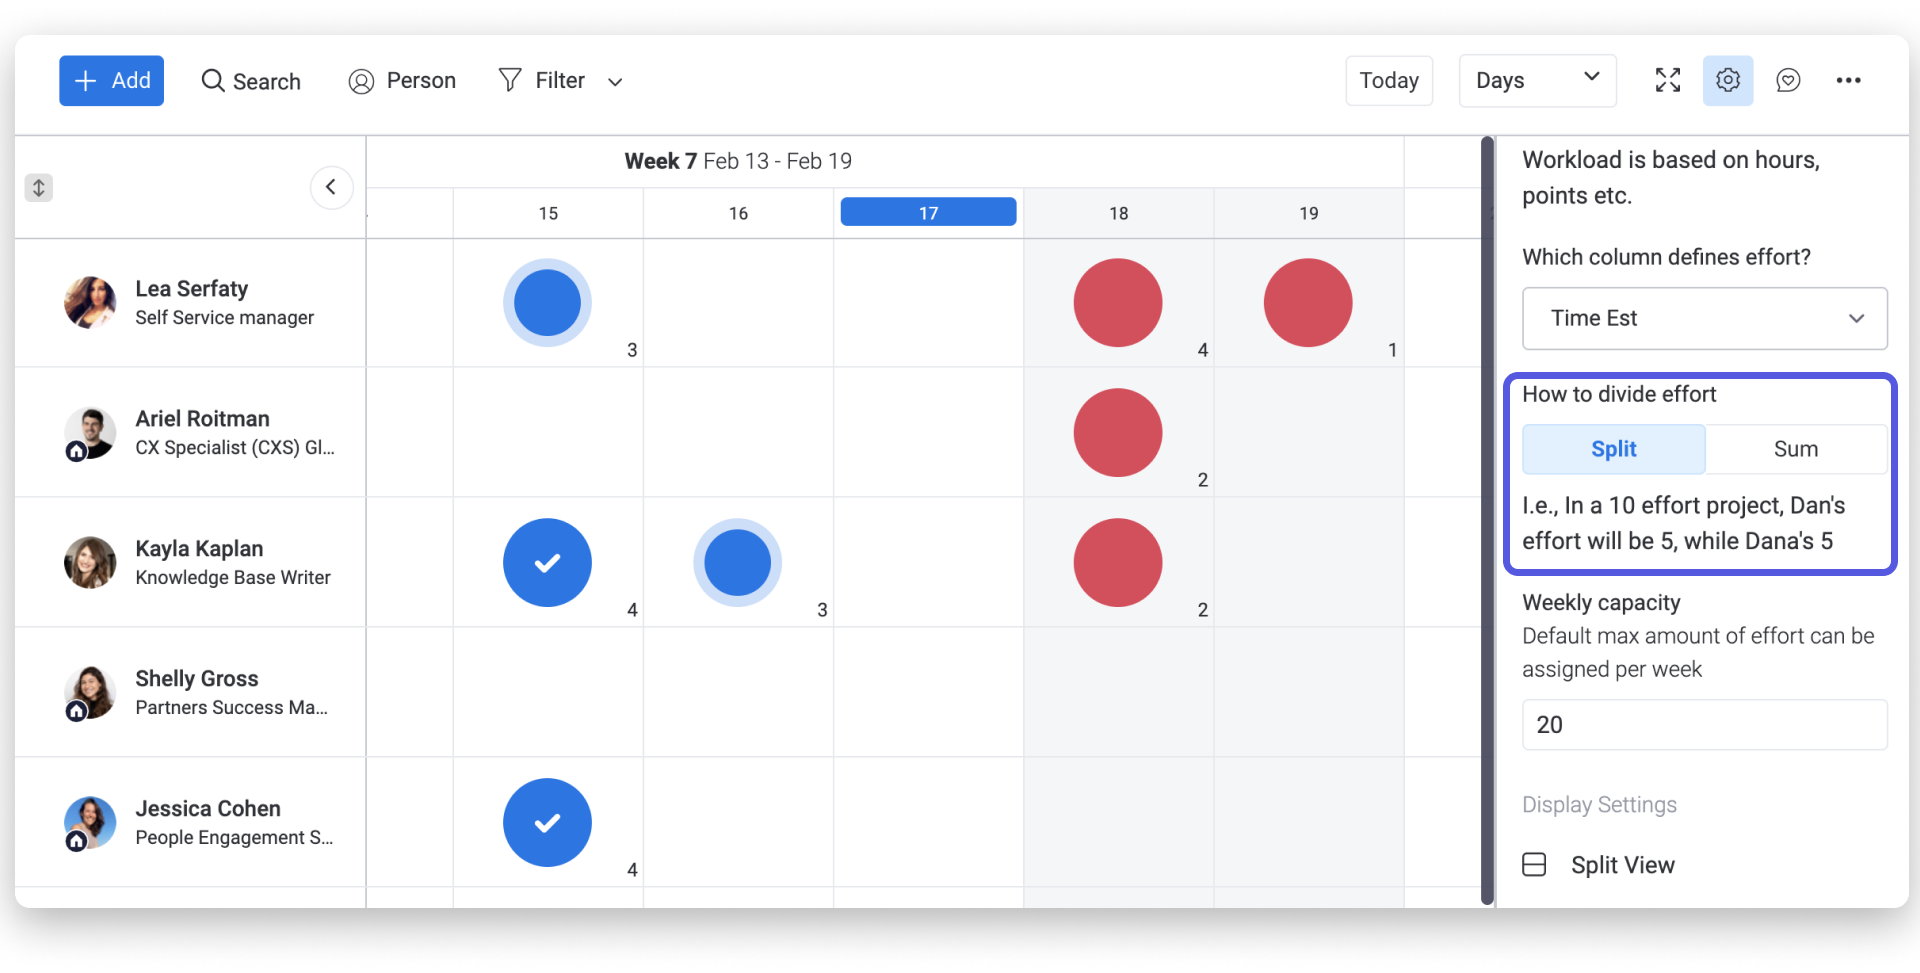
Wanneer meer dan een persoon aan een taak werkt, kunnen we ervoor kiezen om weer te geven hoe ze "de inzet verdelen" tussen hen. We kunnen schakelen tussen "Splitsen", wat de inzet gelijk verdeelt over de partners en "Som" wat aan elk van de partners het totale aantal uren toewijst dat het project kost.

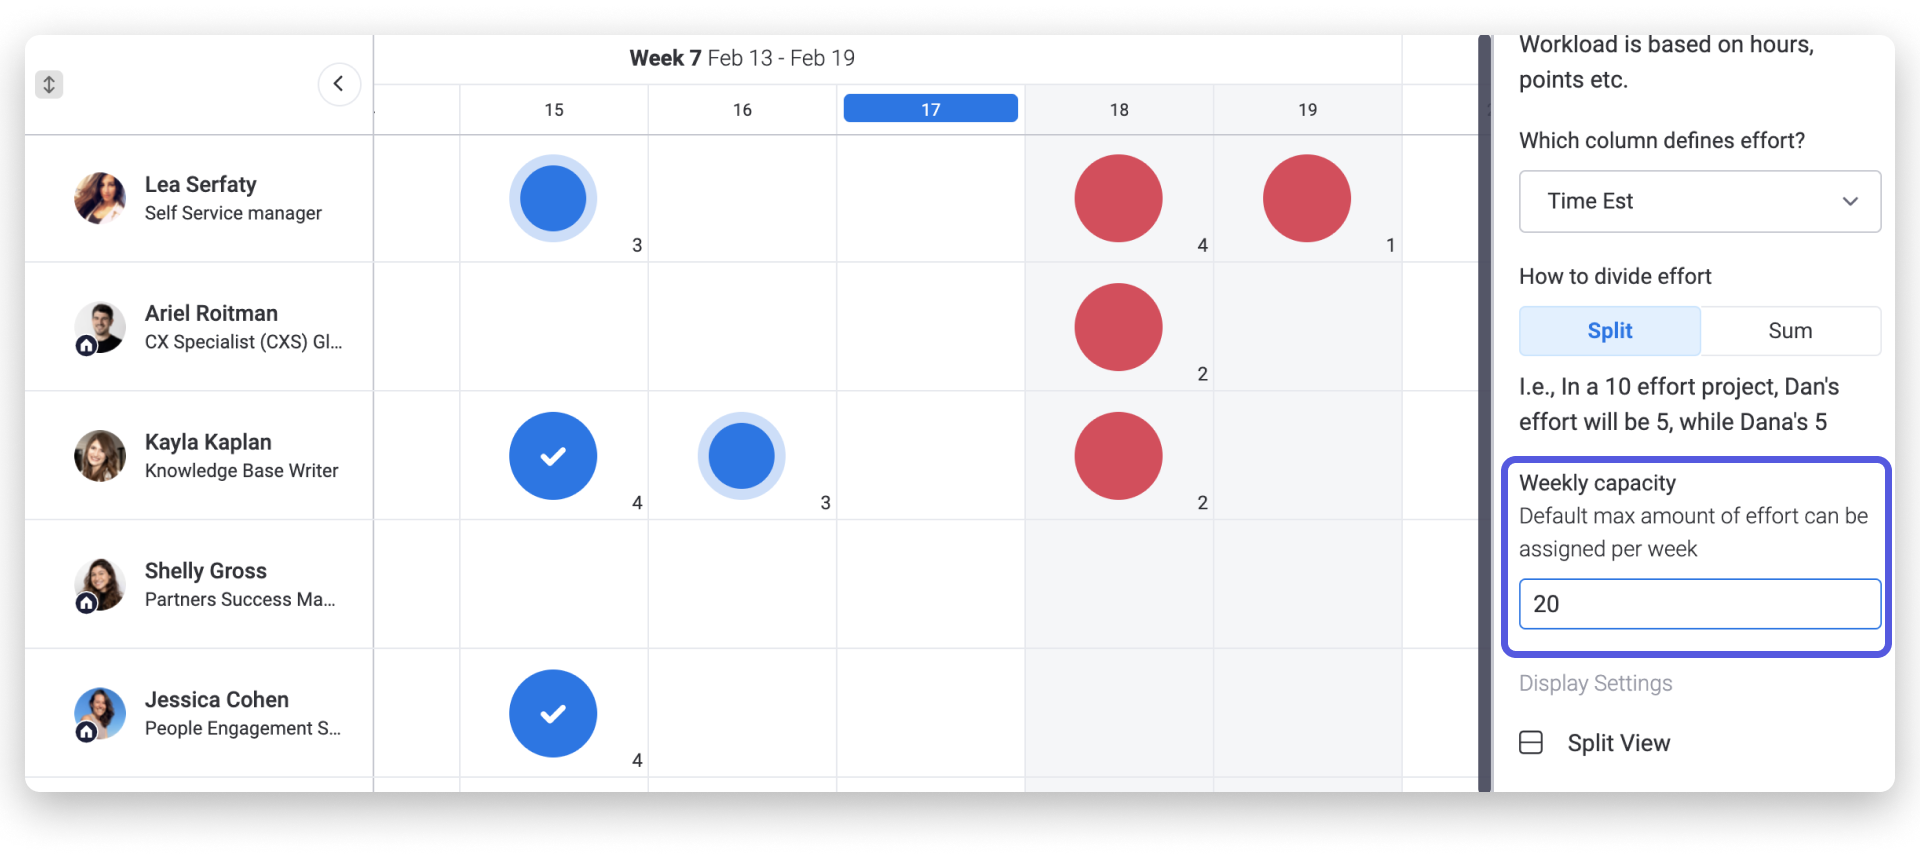
- Wekelijkse capaciteit
Wanneer dit gedaan is kunnen we een wekelijkse capaciteit bepalen voor het gehele team. Dit is de limiet van het aantal uren dat er die week door je team aan die taken besteed gaat worden. In ons voorbeeld stellen we de capaciteit in op 20 uur per week.
Middelen toewijzen
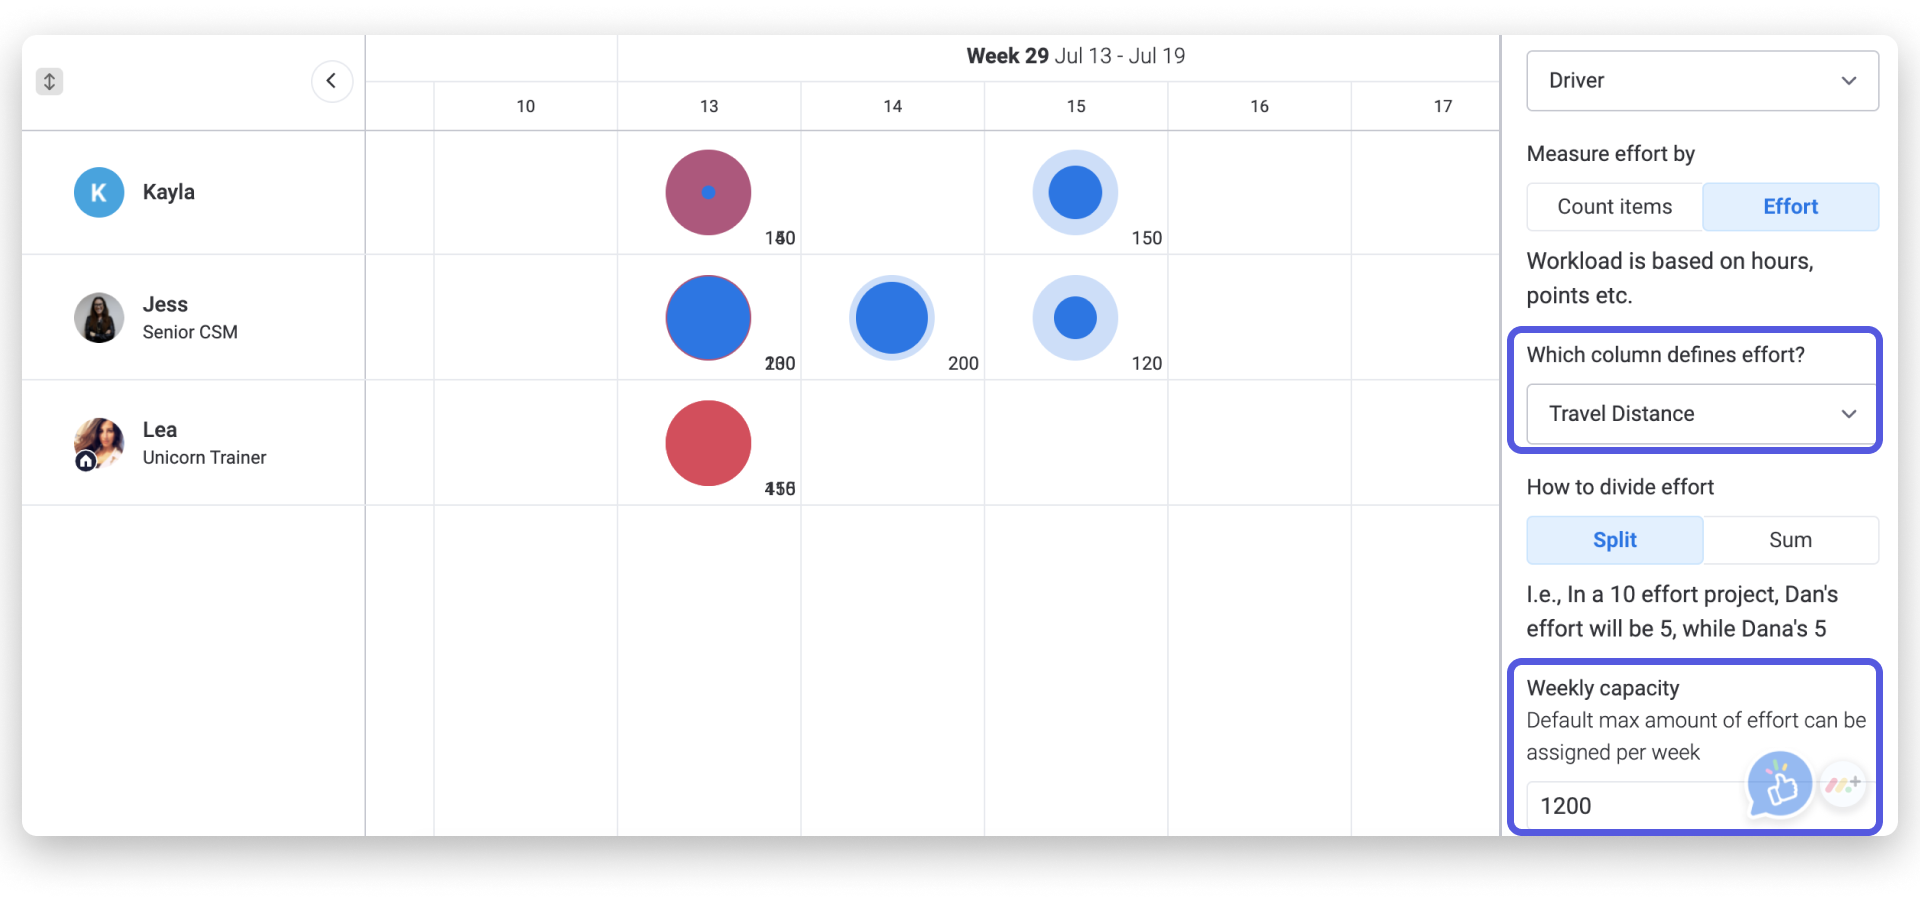
Met de Werklast kun je mensen toewijzen, maar ook middelen. In het onderstaande voorbeeld willen we ervoor zorgen dat geen van onze voertuigen hun wekelijkse limiet van een totale reisafstand van 1200 kilometers overschrijdt. We kunnen onze Werklastweergave instellen om ons precies dat te laten zien!
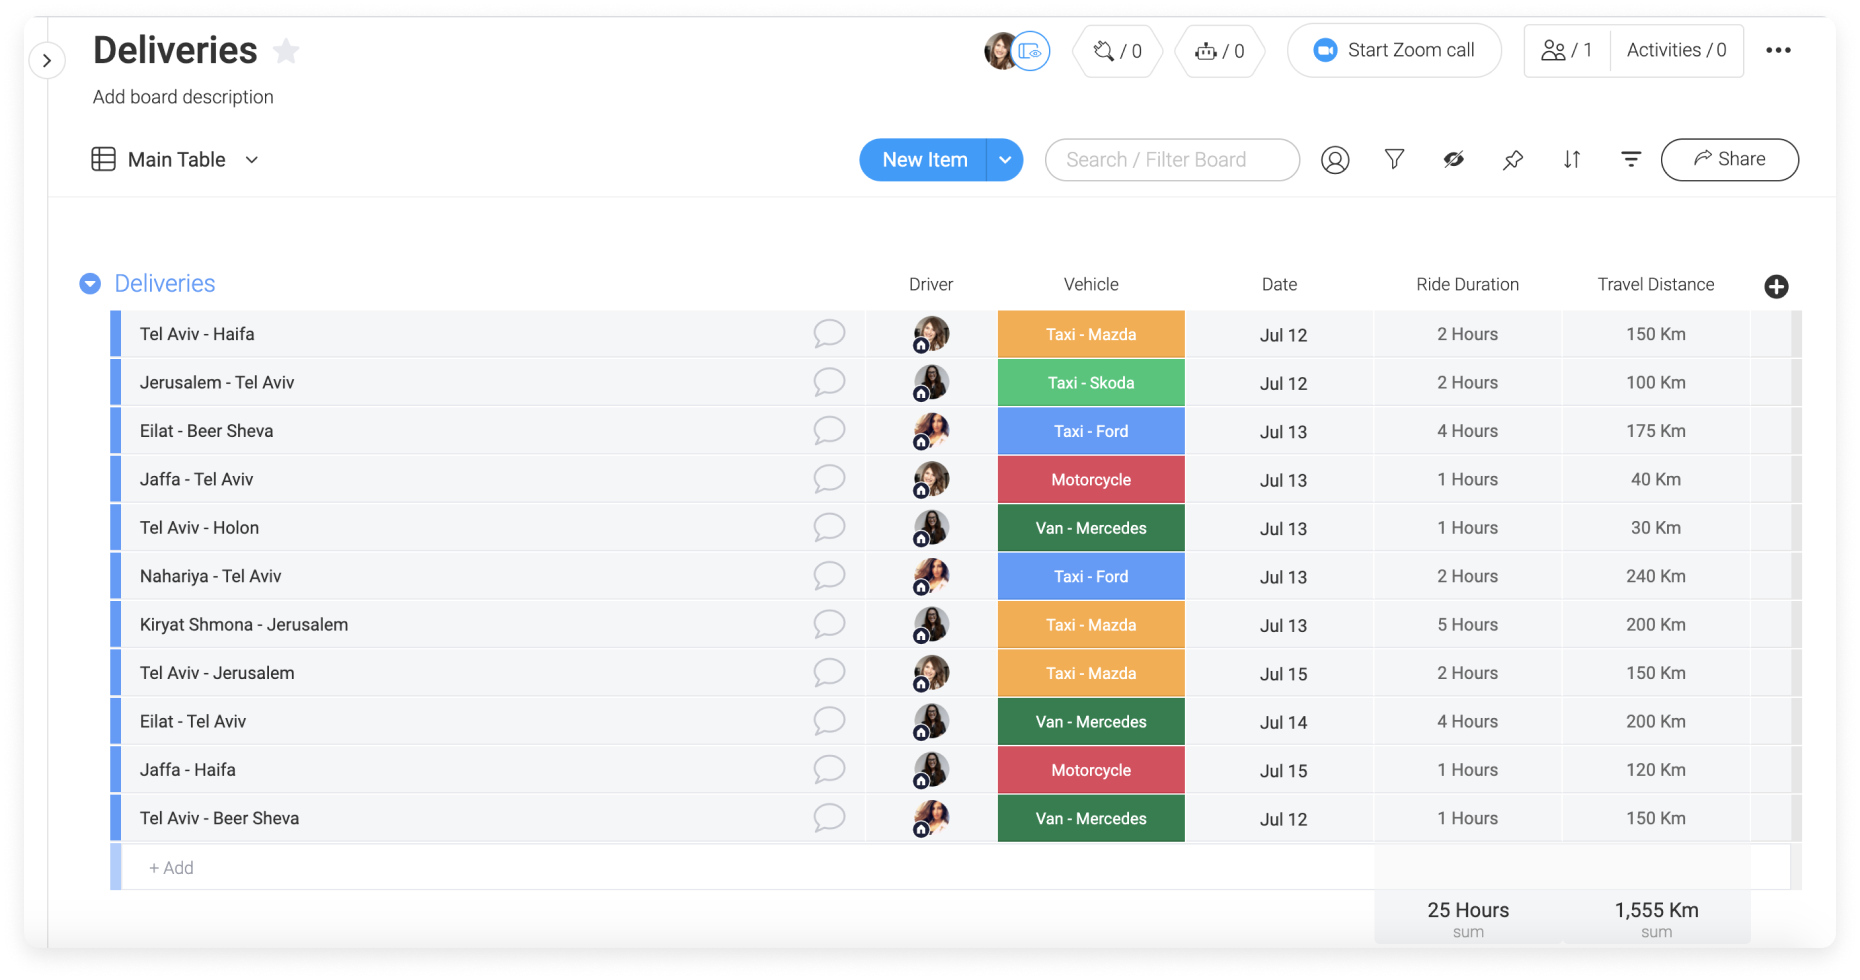
Eerst kiezen we onze "Voertuig" statuskolom als ons type bron en dan kunnen we "Inzet toevoegen" selecteren. We willen onze inspanning definiëren aan de hand van onze "Reisafstand" nummerskolom en vervolgens "1200" invoeren in het veld "Wekelijkse capaciteit" hieronder.
Nu laat onze weergave ons al onze voertuigen zien die in het linkerdeelvenster worden vermeld, en aan de rechterkant kunnen we zien hoeveel kilometer ze elke dag van de week zullen afleggen. We zien dat onze Ford zijn limiet op de dertiende zal overschrijden, dus kunnen we alvast een ander voertuig voor deze levering inplannen!
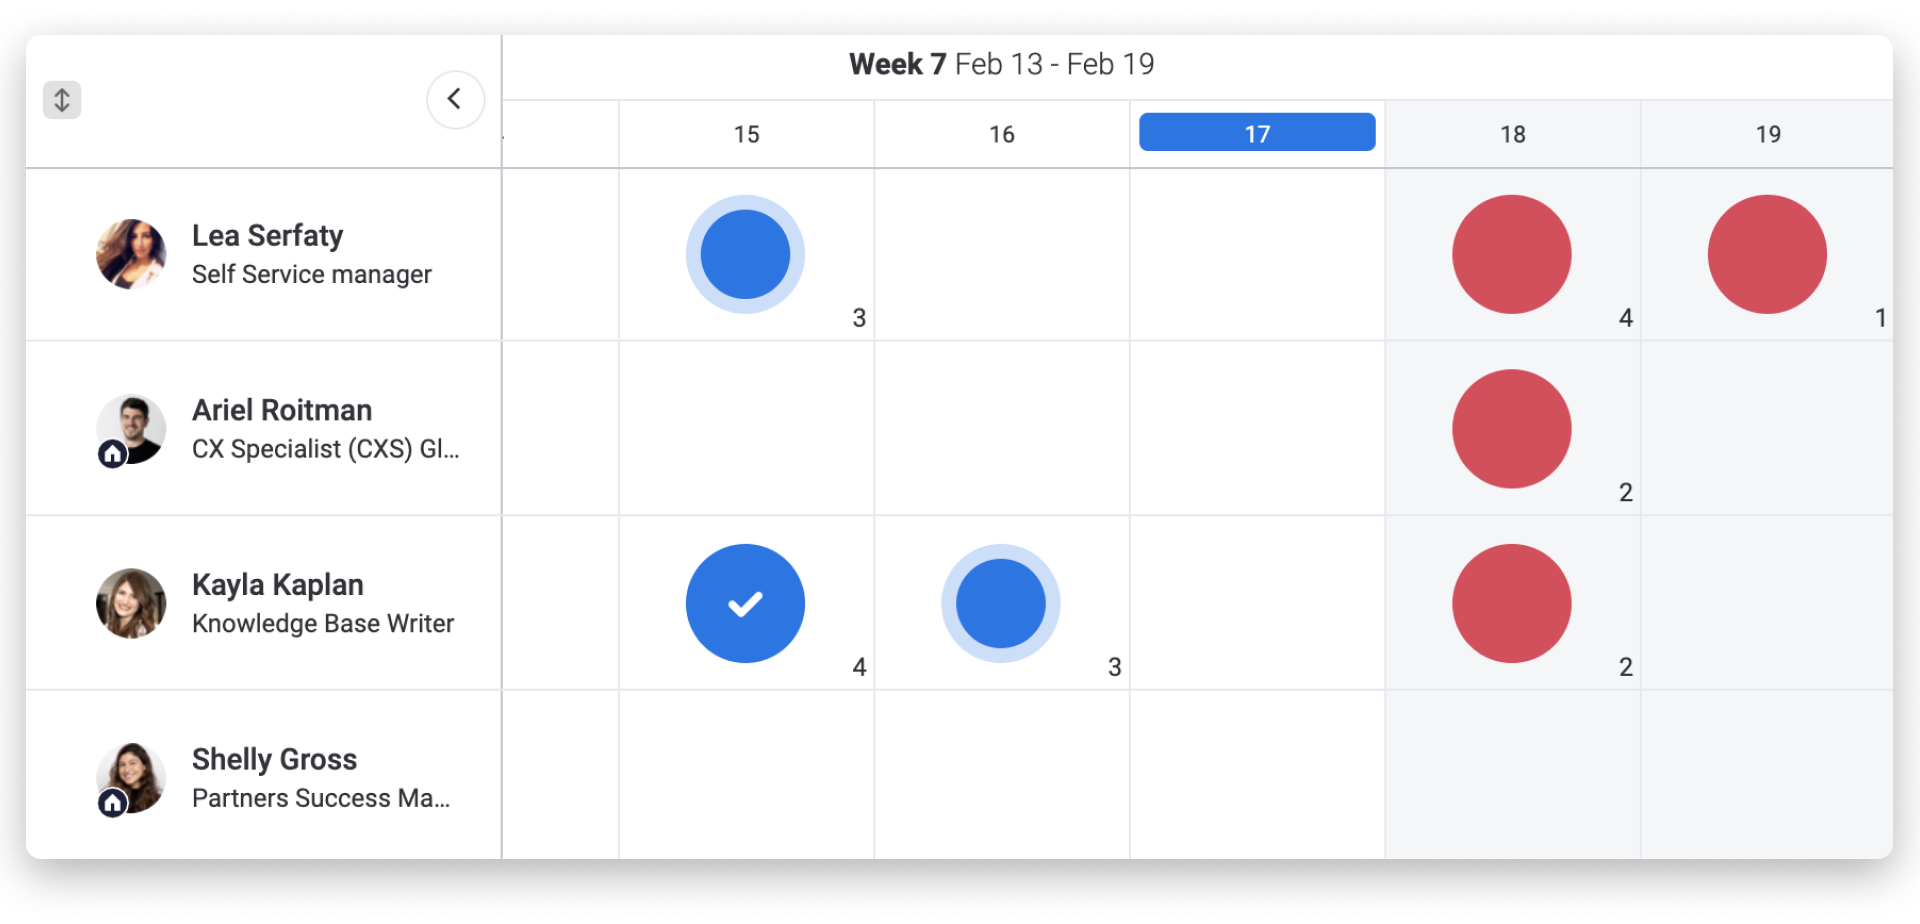
De kleuren begrijpen
🔵 Blauwe bol - De persoon zit onder de maximale hoeveelheid inspanning. Je kunt taken blijven toewijzen!
✔️ Blauwe bol met een vinkje - Je zit precies op de wekelijkse capaciteit!
🔴 Rode bol - De persoon zit boven de ingestelde wekelijkse capaciteitslimiet
Je kunt de werklast van het team bekijken per dag, week of maand.
De resultaten begrijpen
Laten we teruggaan naar het voorbeeld van ons klantsuccesbord. Hier is Lea toegewezen aan twee taken, die elk 1,5 uur duren.
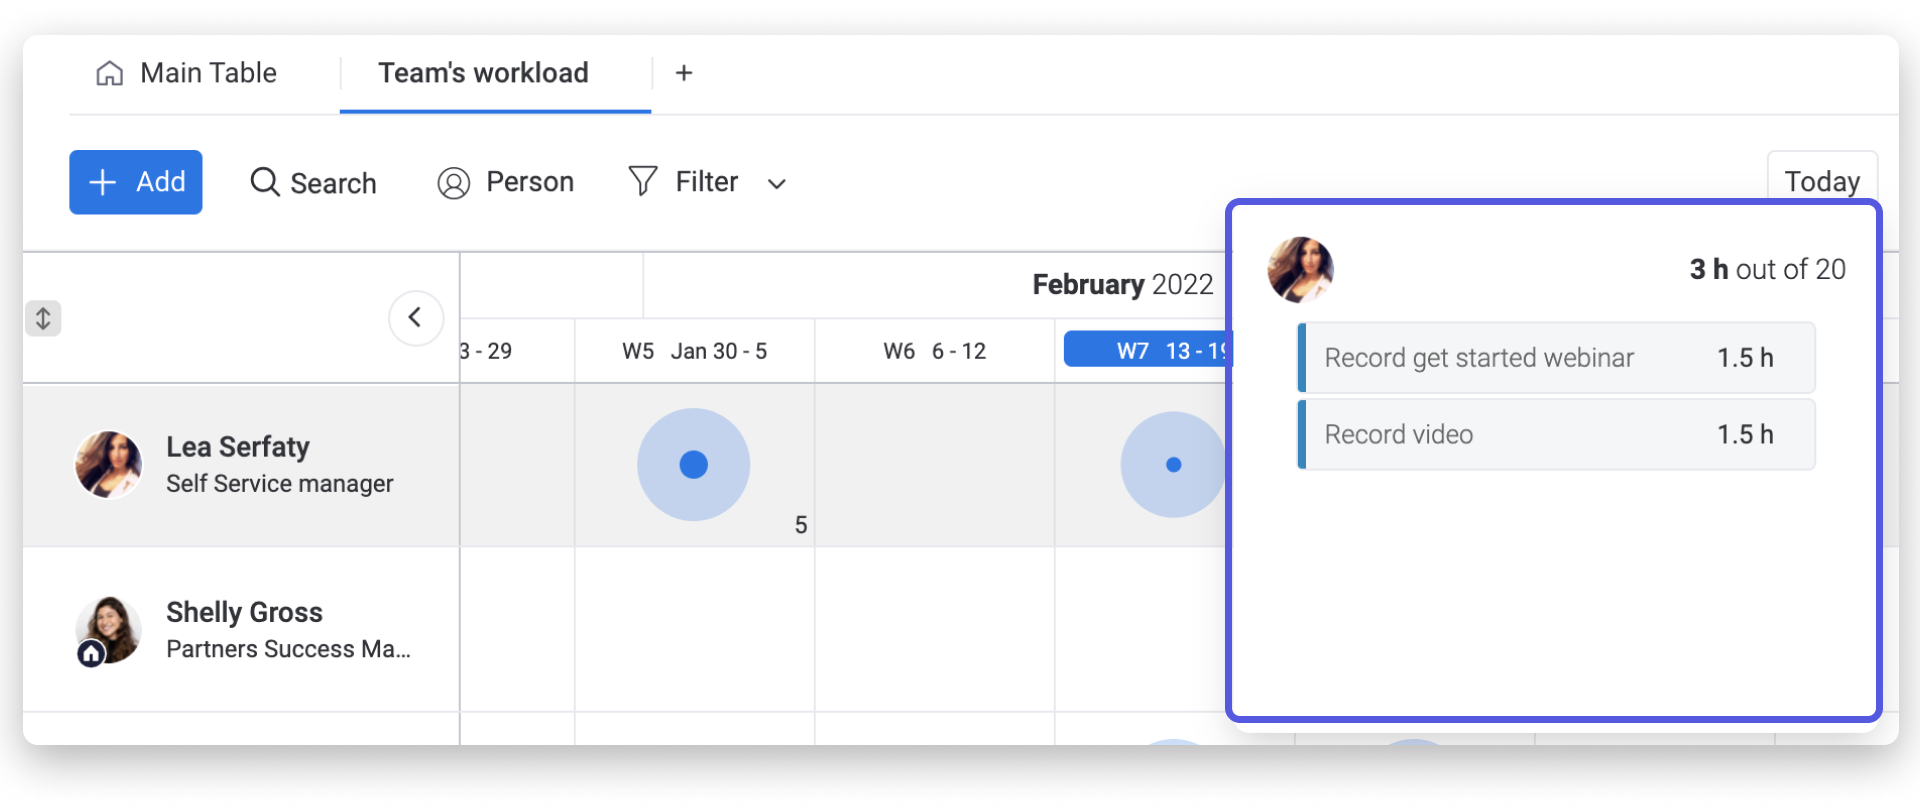
Om de resultaten te begrijpen moeten we twee factoren in ogenschouw nemen:
- Hoeveel uur het duurt om de taak te voltooien
- Hoeveel dagen we hebben om het te voltooien.
Laten we teruggaan naar ons bord:
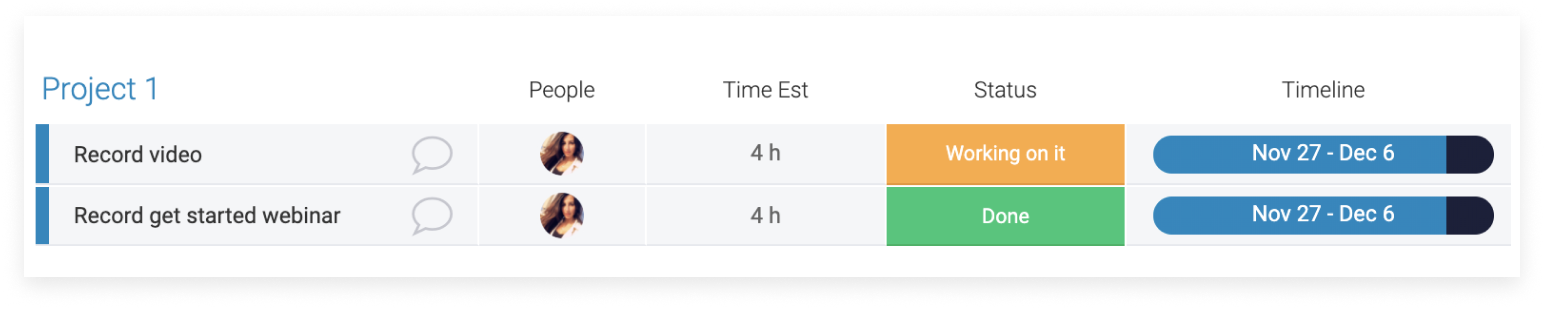
In dit voorbeeld duurt het opnemen van een video 4 uren en het moet voltooid zijn binnen 8 werkdagen, exclusief de weekenden. Dat betekent dat we dagelijks een half uur werk aan deze taak moeten besteden. Dit is slechts een simpele wiskundige vergelijking:
Zoom in voor meer details
Als je de taken van je team van dichterbij wilt bekijken kun je op iedere willekeurige cirkel klikken om de taken die binnen dat tijdsframe staan te bekijken.
Mocht je vragen hebben, neem dan hier contact op met ons team. We zijn 24/7 beschikbaar en helpen je graag.
Opmerkingen