


 4 min read
 Feature
Managing projects is nothing short of challenging! As all projects have some type of deadline, it's critical to finish the project on time and reach all milestone deadlines along the way. Have a clearer perspective of your project's path with the Gantt Baseline feature by taking snapshots to keep an eye on where your project stands at all times. Let's dive in! 😊
What is a baseline?
A baseline is a project management tool used to outline the target schedule of a project. It can be used as a frame of reference to compare the current project progression (after any delays or changes) to the original planned schedule. In other words, it's a great way to visually understand the project's overall progression over time. It's best to add a baseline at the beginning of a project so that it can be a reference point throughout the project's lifetime.
How to add a baseline
You are ready to take a baseline snapshot as soon as your Gantt Chart is created! Click on "Baseline" at the top of your Gantt and select the "Add a new snapshot" option in the "Baselines" section in Settings. The baseline snapshot will show gray timeline bars.
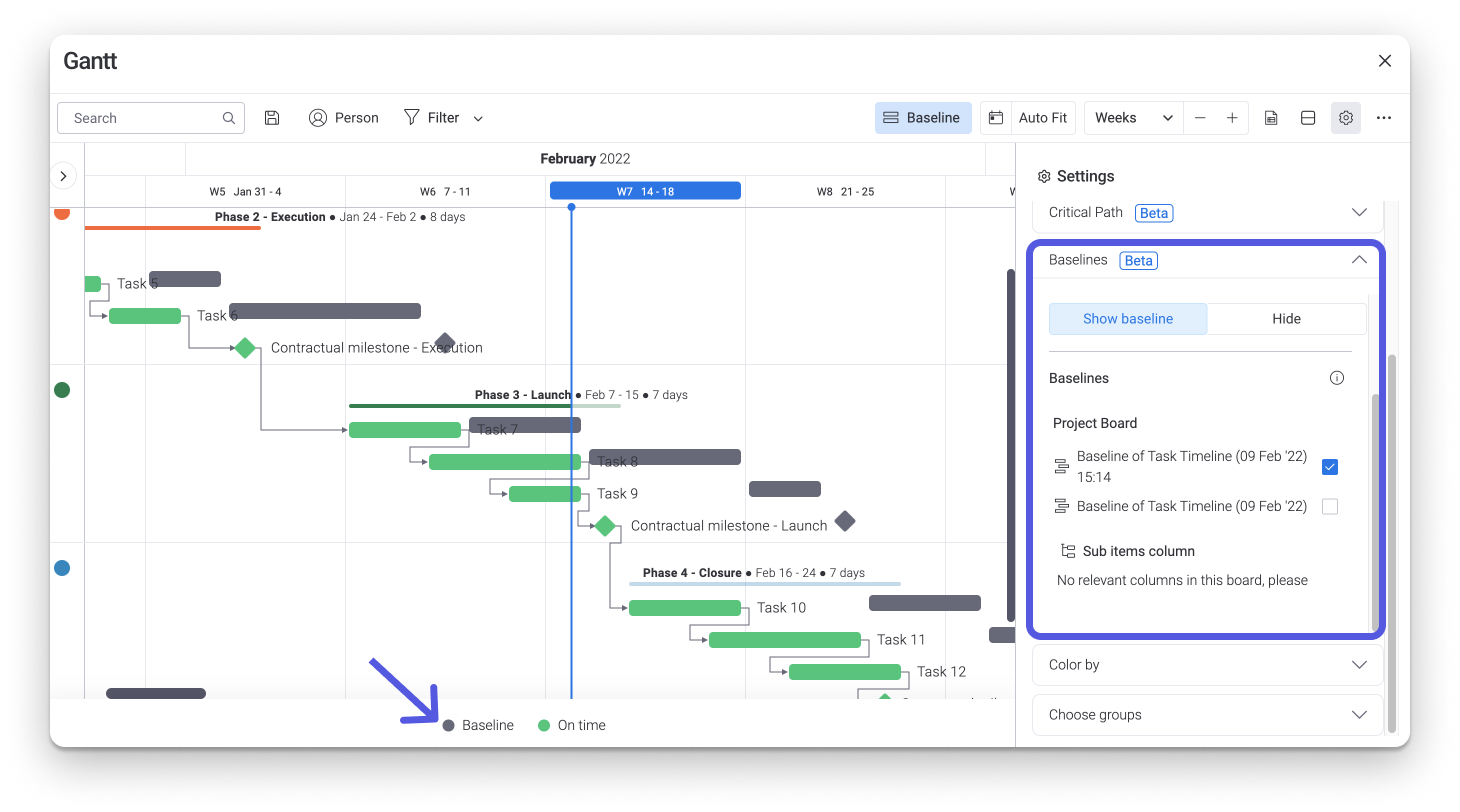
You will see a list of all of your existing baselines in the "Baselines" section of Settings, named after the Timeline Column they reflect and the date they were created! Select any baseline snapshot and easily compare it at a glance to where your project currently stands.
How are timeline changes reflected?
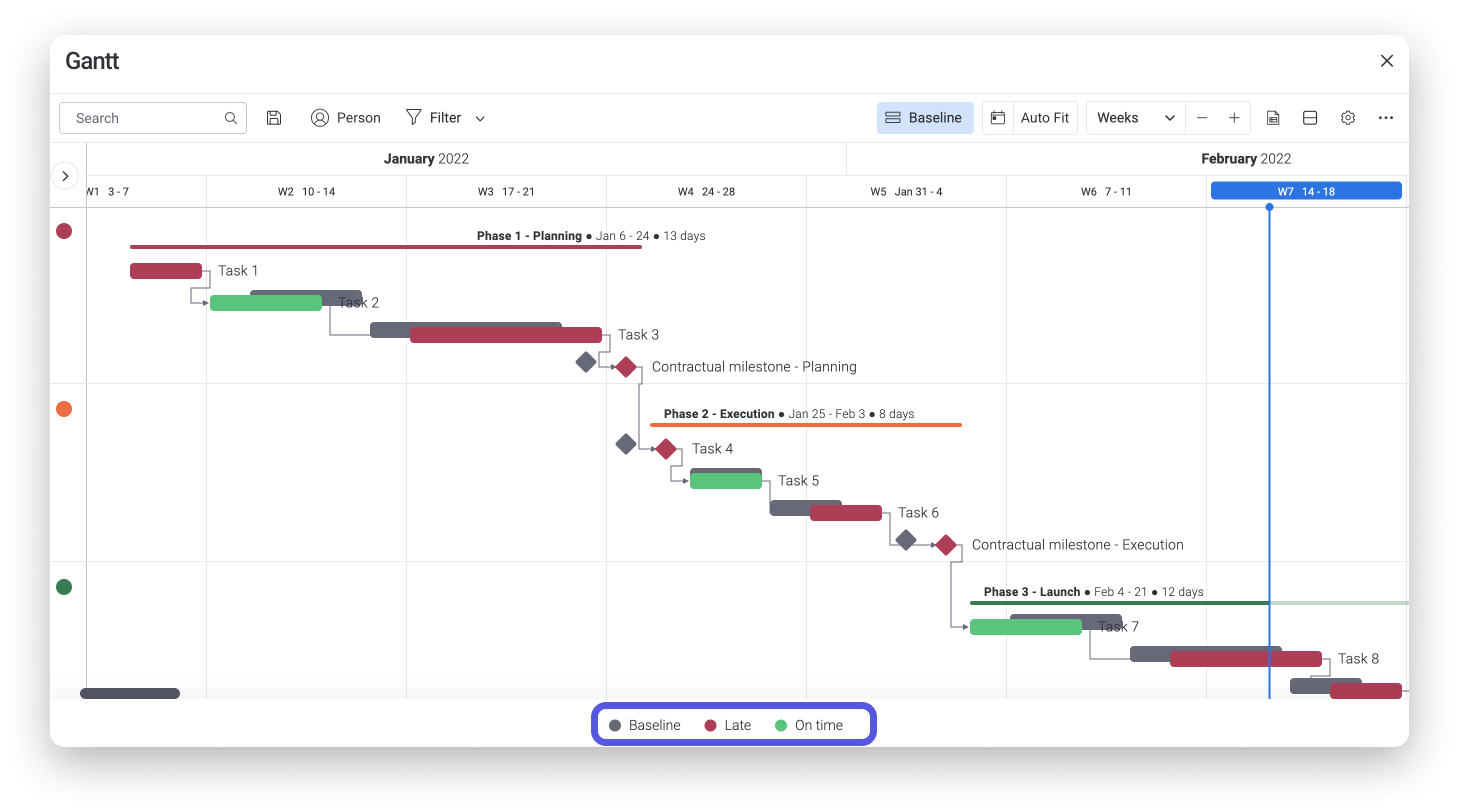
When a baseline is created, items are turned into a gray snapshot that remains locked in position no matter what happens to the timeline of the items afterwards. When a project is on track, items are shown in green. When a project is delayed and we extend the timeline bars, items turn red along with any dependent items. The baseline snapshots will show as a gray shadow above the items, giving a comprehensive view at a glance!
Baseline settings
Now that we have our baseline added to our Gantt, let's take a look at some of the settings and understand how they work!
- Color by status
When viewing a baseline, the "Color by" setting is automatically disabled and our items are colored based on their status in relation to our baseline. The baseline will always be showcased as a gray shadow above the item in exactly the position it was in when the snapshot was taken. If an item is on time, it will appear in green, and if an item is late, it will be red. You can always refer to the color legend at the bottom of the Gantt chart to see these elements. 😊
- Hide and show baseline
We can easily toggle between our baseline and Gantt chart by clicking "Show baseline" or "Hide" from the "Baselines" section of our Settings:
- Compare baselines
We can also switch between different baseline snapshots by ticking and unticking the box beside the name of the baseline. This is especially useful if we want to compare snapshots from different stages of the project or if we are using the widget and want to compare projects from different boards:
If we have no baselines selected, we will see where our items stand currently in a light gray with no dark gray baseline to compare them with. There's a legend at the bottom of our screen if we forget what the colors represent! If you want to return to your regular colored Gantt chart, just click "Hide" to turn off baseline mode.
What happens to my board?
The Gantt Chart is not the only thing that changes once a baseline is added. There are a few changes that occur in your board as well! Let's take a look at these changes.
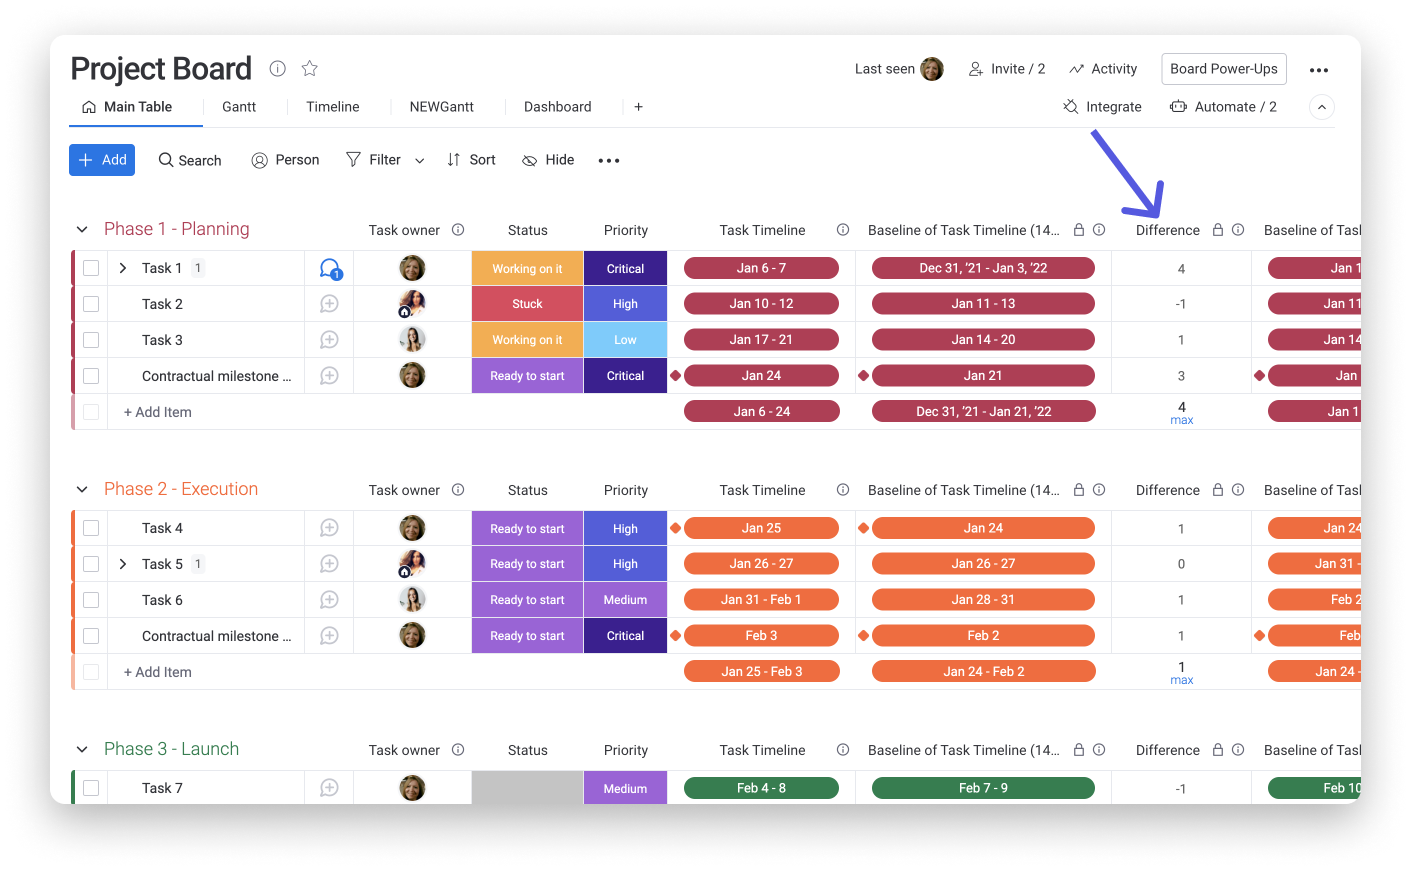
- The Time Column is duplicated
When a baseline is created, we are essentially taking a snapshot of the time column (Timeline or Date Column) at any given moment. To make sure our baseline stays in place while still allowing us to make any necessary changes in the future, this feature automatically duplicates the Time Column/s on our board and locks them in place. This way, there is always one Date or Timeline Column reflecting the original dates, while the other Date or Timeline Column reflects the baseline snapshots.

- Formula Column is created
The second change that occurs within our board once we've added a baseline is the addition of a Formula Column. Now that we have a column showing us the original date/s and a column showing the current date/s, we may want to understand what the difference is. The Formula Column is automatically created to calculate the difference in days between the dates in these two columns!
If you have any questions, please reach out to our team right here. We’re available 24/7 and happy to help.
Comments