


 4 min read
 Feature
Dashboards are a great way to display what's important in one convenient place. With widgets, users can understand project progress, track budgets, estimate teammates' workload and so much more! Easily see your most important widgets from the monday.com mobile app so you can remain connected to your work at all times!
How to create a dashboard
At this time, dashboards can only be created on your desktop, but can be accessed and viewed on your mobile whenever you need them! Head over to your desktop to create the perfect dynamic dashboard for your team! Take a look at this article to learn about all of the different widgets and how to customize your dashboard!
Where to find them
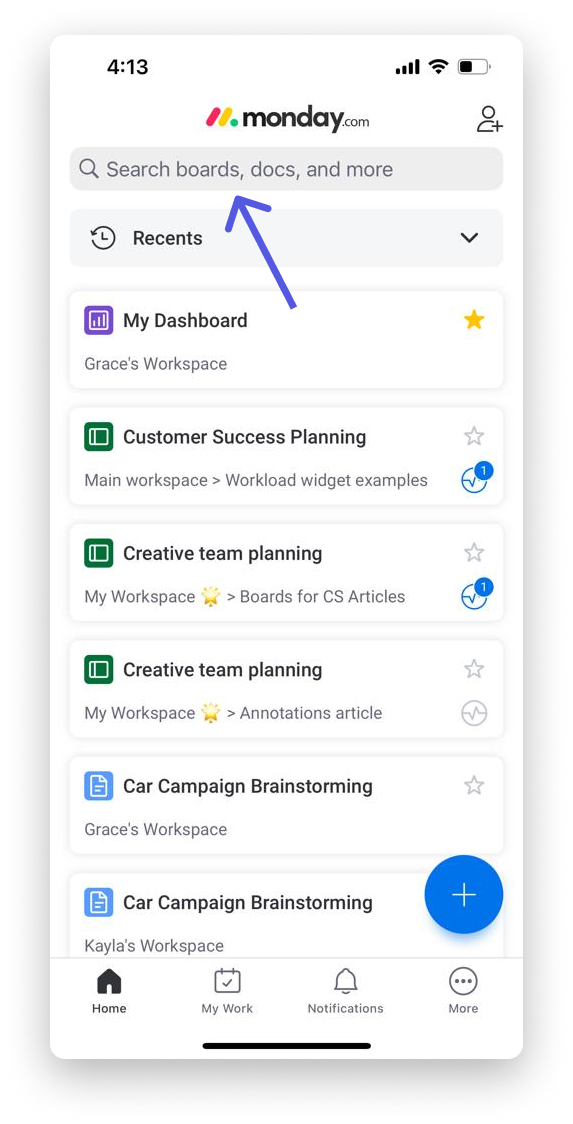
To open up your Dashboards on the mobile app, simply search in your general home screen search bar!
View your dashboard
When you open up your Dashboard, you can view all of your widgets in full screen! Scroll through your dashboard to check up on all of your stats and updates!
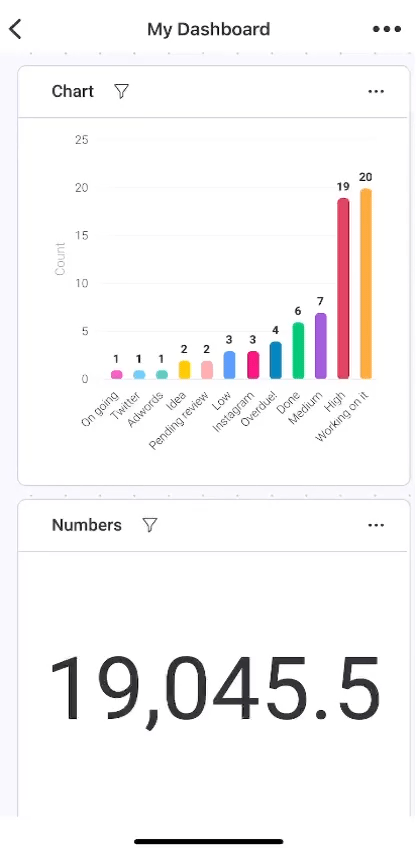
Let's take a look at some of the widgets you can view on your mobile device!
Charts
Drill down to the details of your charts! When you click on a section of your chart, see what it represents! For example, this pie chart below represents the groups on our boards. When we click a slice of the pie, we can see which group it represents, how many items are in this group, and what percentage of our boards this group makes up!
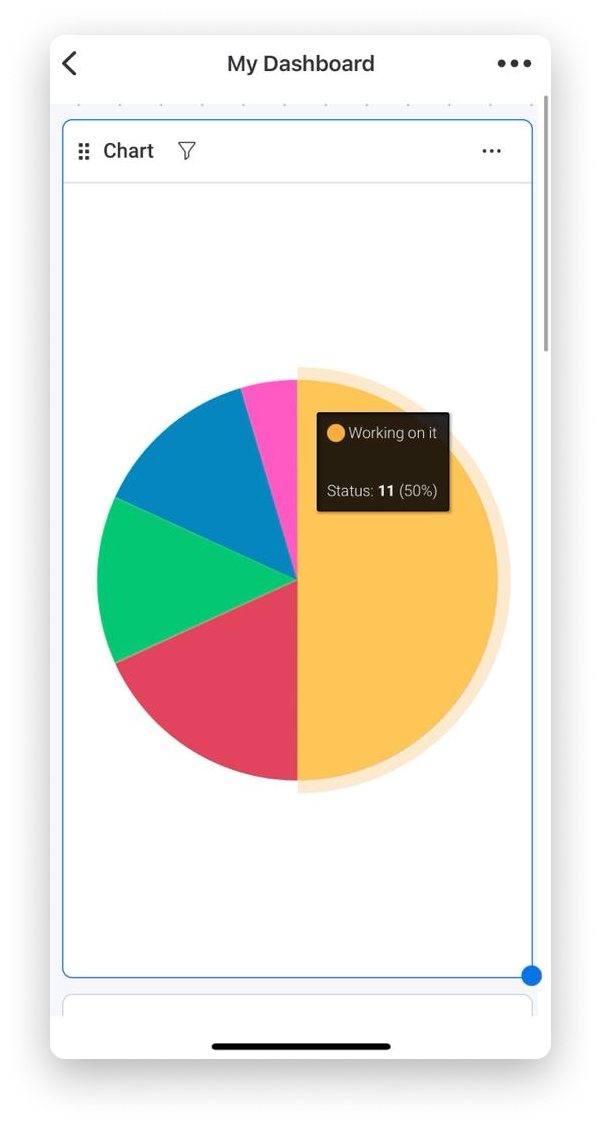
Check out this article to learn more about how you can customize it from your desktop!
Numbers
The Numbers Widget displays a total sum from the Numbers Columns across your boards. In this example, our Numbers Widget displays the total sum of our budget spent across all of the boards connected to our dashboard! When we tap the widget, we can see the unit in blue down below (this can be sum, average, count, max, etc!).
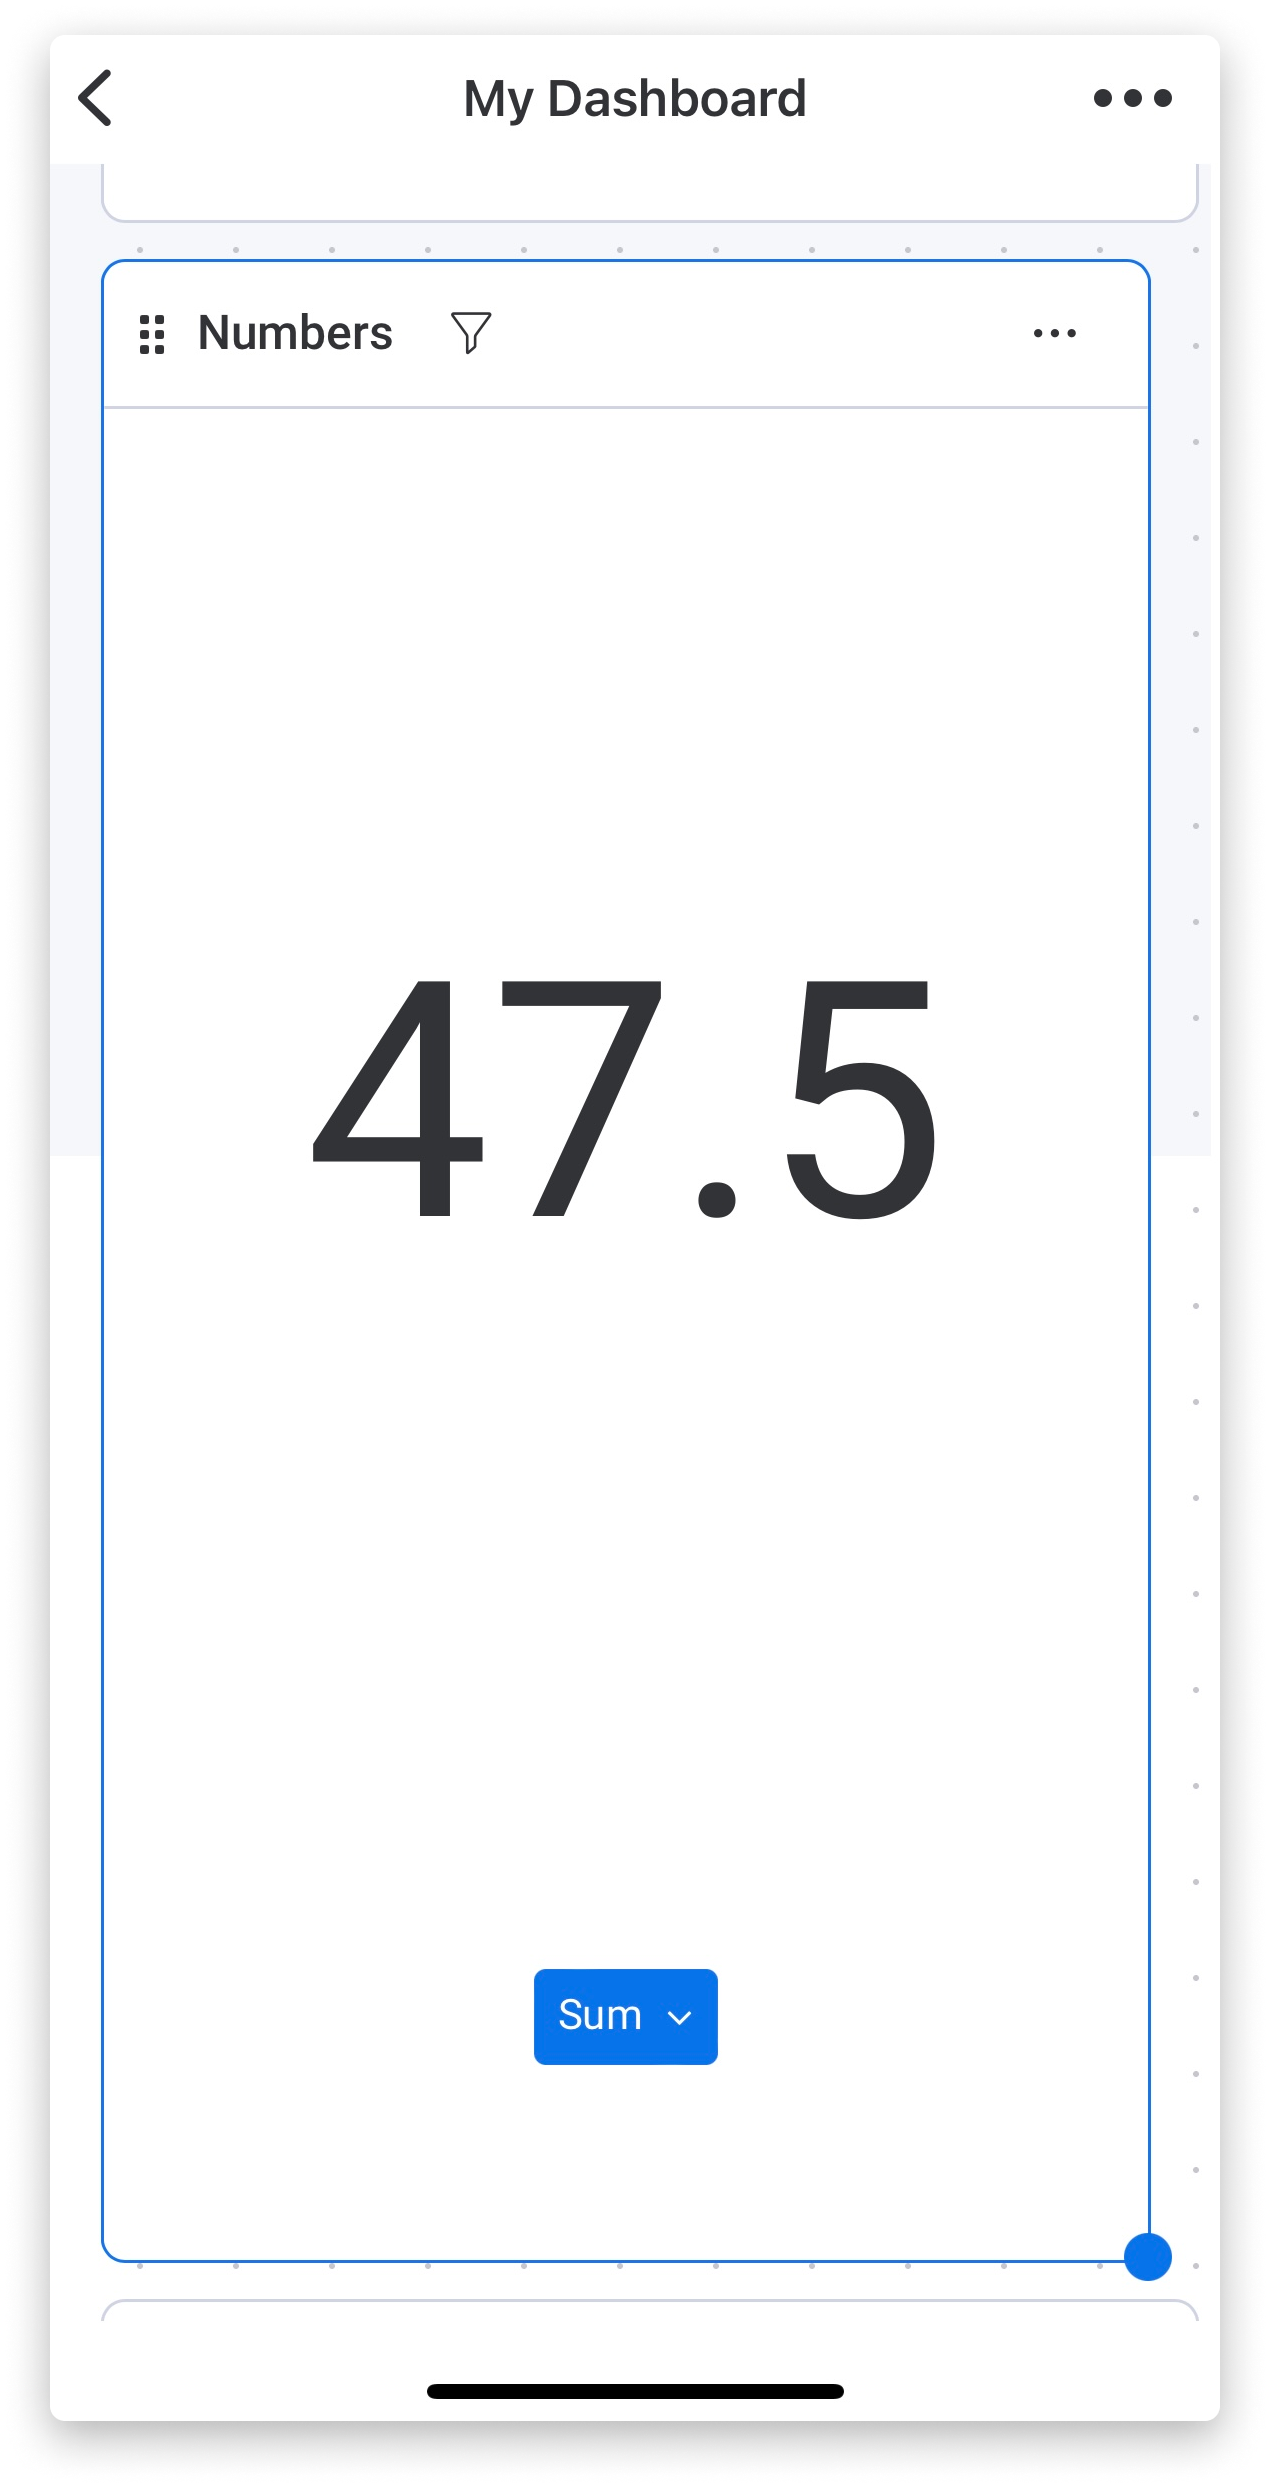
Read this article to learn more about how you can customize it from your desktop!
Calendar
The Calendar Widget displays the items from all of your connected boards in a calendar according to the Date or Timeline Columns on your boards. They are color-coded according to your widget's settings to help you to identify them from your mobile dashboard!
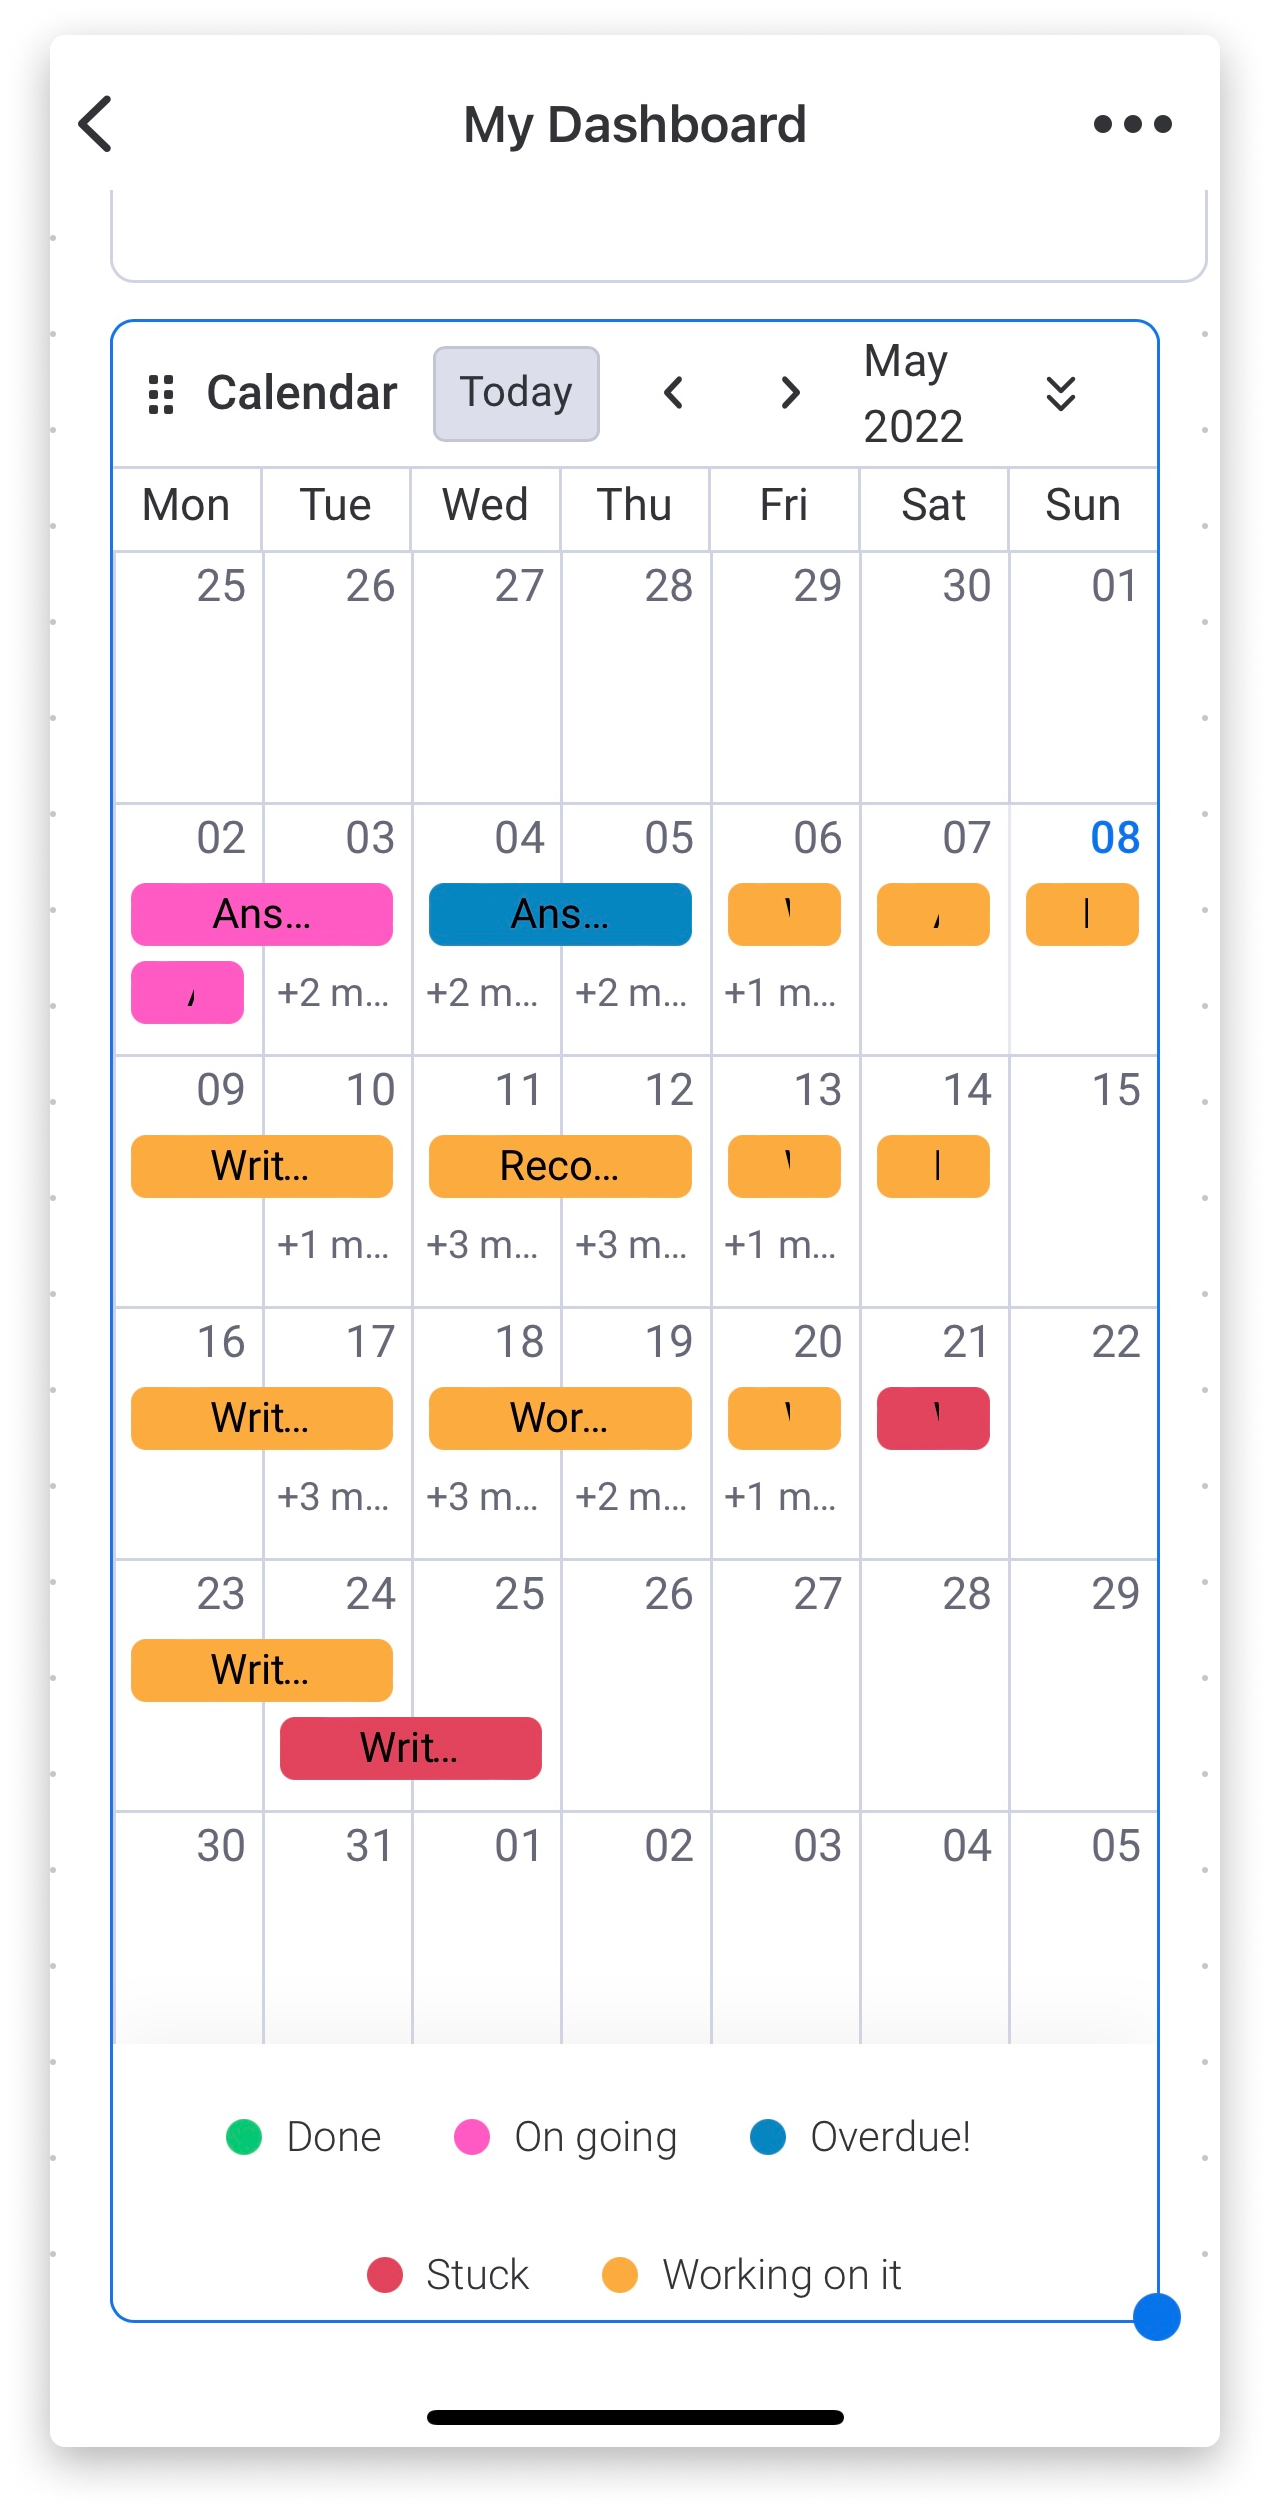
Take a look at this article to learn more about how you can customize it from your desktop!
Battery
The Battery Widget allows you to keep track of the progress of your boards in just one place. The different status labels used in your boards are represented as colored circles at the bottom of your widget. Click the circle to display the name of the label and the percentage of items marked with this label across your connected boards!
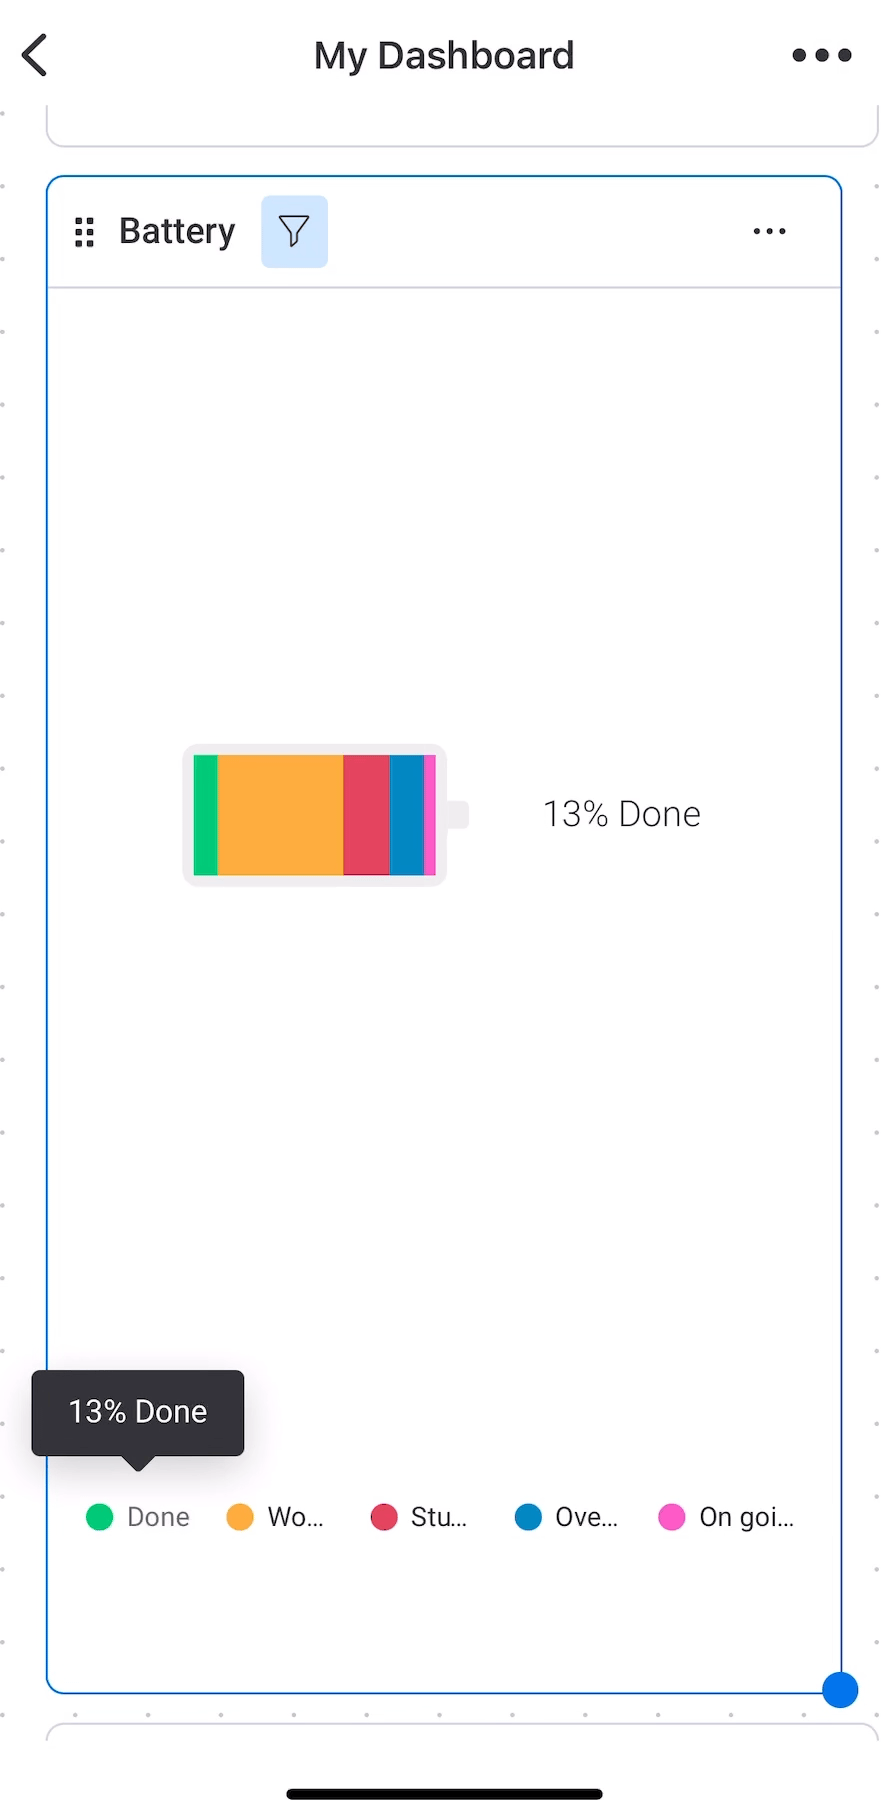
You can read this article to learn how to customize it from your desktop.
If you have any questions, please reach out to our team right here. We’re available 24/7 and happy to help.
Comments