


 4 min read
 Guide
Guide
Managing risks is a crucial component in any successful PMO workflow. It is inevitable that issues will arise and having a strategy to alleviate risks is important for projects to stay on track and teams to meet their goals. monday projects allows you to calculate project risks before they arise, and assess, track, and mitigate them with real-time data throughout the project lifecycle. Incorporating risk management into your project planning has never been easier with our Risk Register Board!
Remain aware of risks
Project risk management is the process of identifying, analyzing and responding to any risk that arises over the life cycle of a project to help the project remain on track and meet its goal. Risk management is part of the planning process so teams don't find themselves in a reactive state to potential threats—but rather aware of issues from the beginning of the planning process and ready to mitigate them as they arise.
Track your risks
Organizing your risks has never been easier! Our Risk Register board is divided into groups that represent the individual projects currently being worked on and items within each group showcase the potential risks being analyzed. The board is further segmented by columns calculating the important data points such as risk status, probability, impact, risk level, and more:
Create transparency in your workflow
Getting an organized insight into project risks helps your goals come to fruition. One of the key highlights of the Risk Register board is that it is connected to the Portfolio Management board through the Connect Boards column and the key information concerning risk factor is mirrored to the Portfolio Management board: 
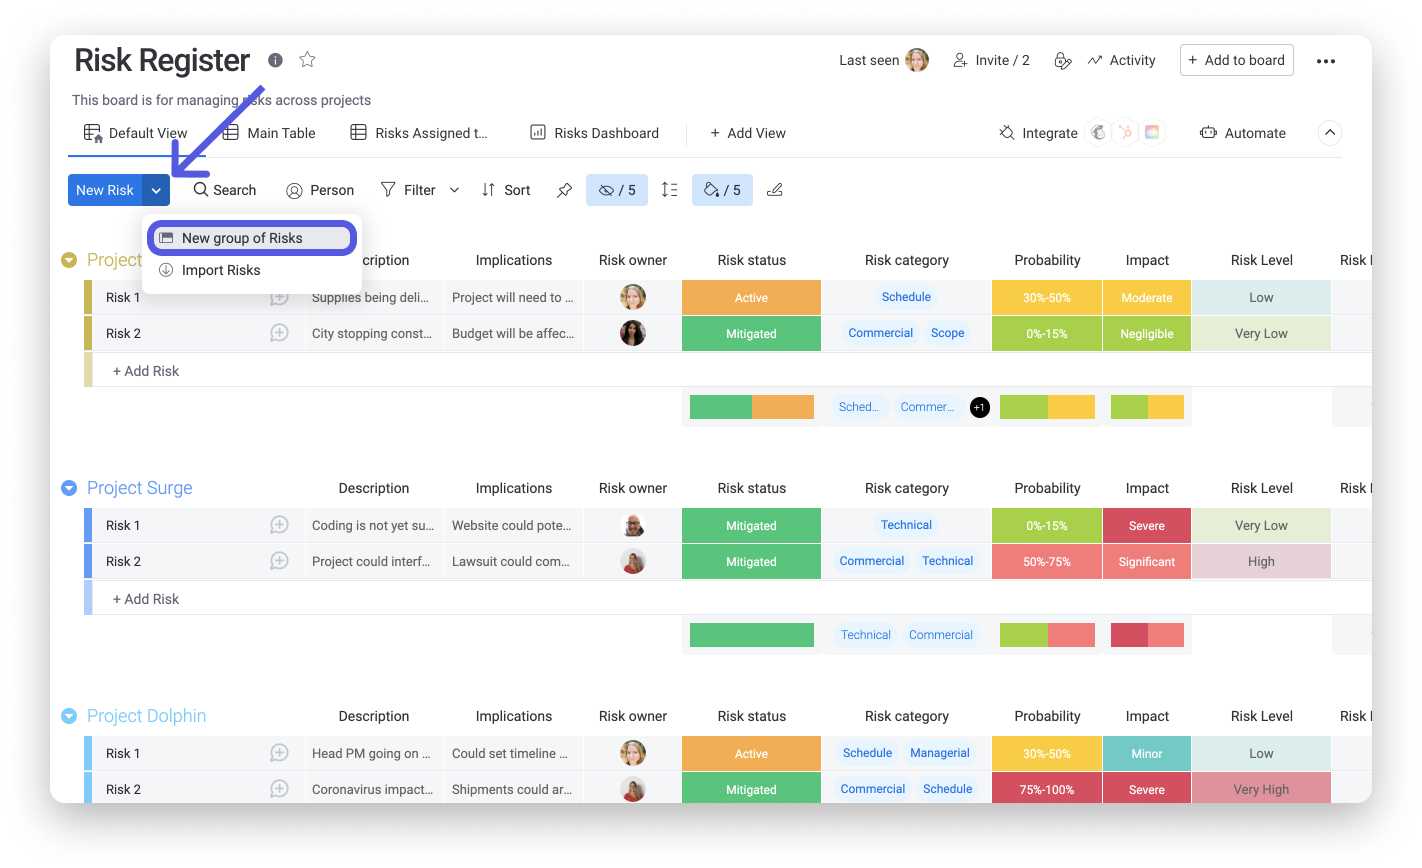
Once your project is designated as active in the Portfolio Management board, it's time to add it to the Risk Register board! Click on "New Risk" in the upper left corner of the board and "New group of Risks" from the dropdown menu. This will create a new group with our designated columns that is easily customizable for your new active project:
Gain insight with risk scores
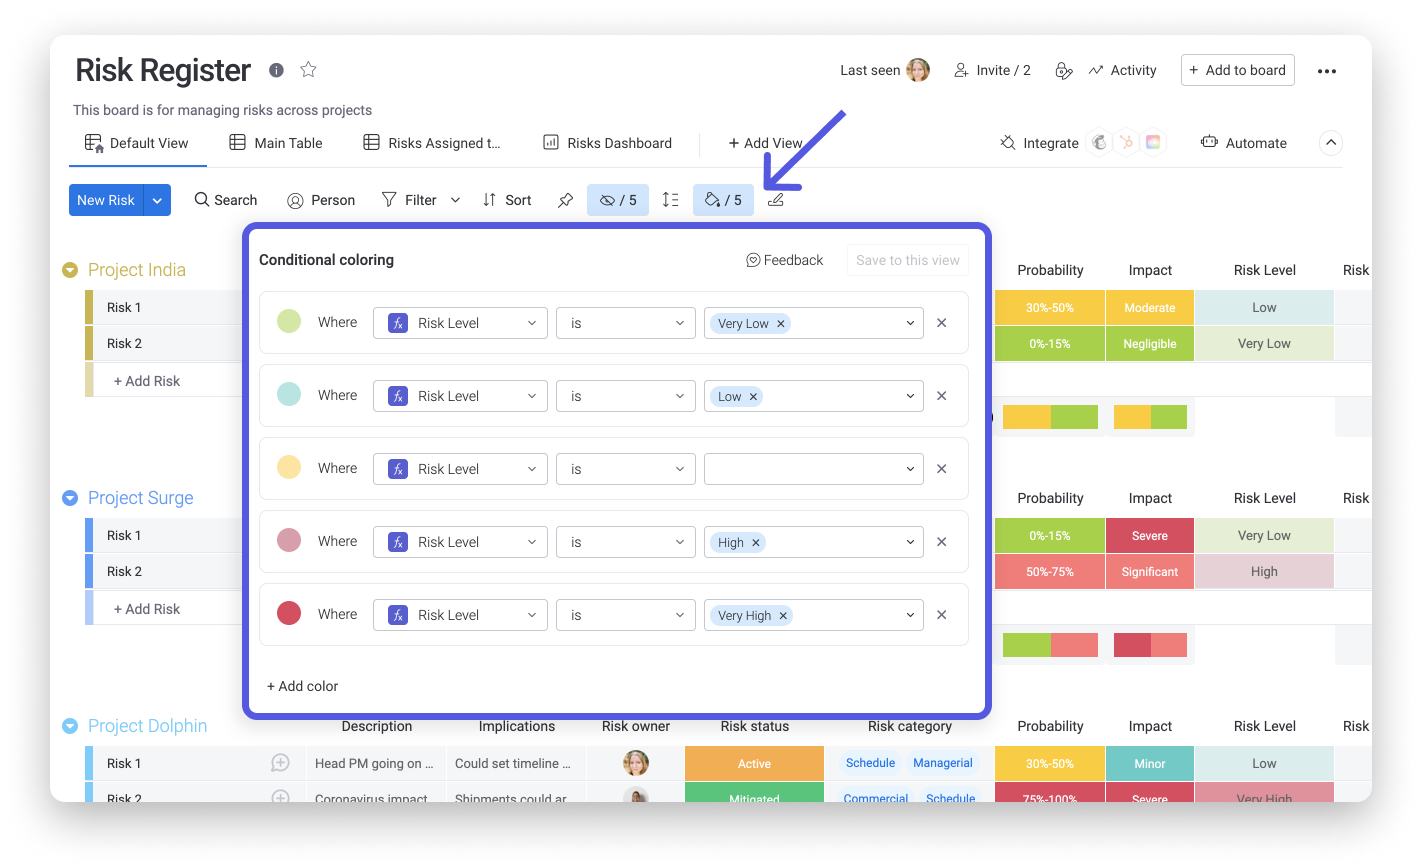
No risk is created equal. Risk scores allow you to easily recognize the urgency of your project risks at a glance! A risk score is a calculated number, based on gathered statistics, that reflects the level of each risk. The Risk Register board is made up of several formula columns that weigh sets of data together from particular status and numbers columns to decide the impact each risk will have, and therefore which risks need to be prioritized.

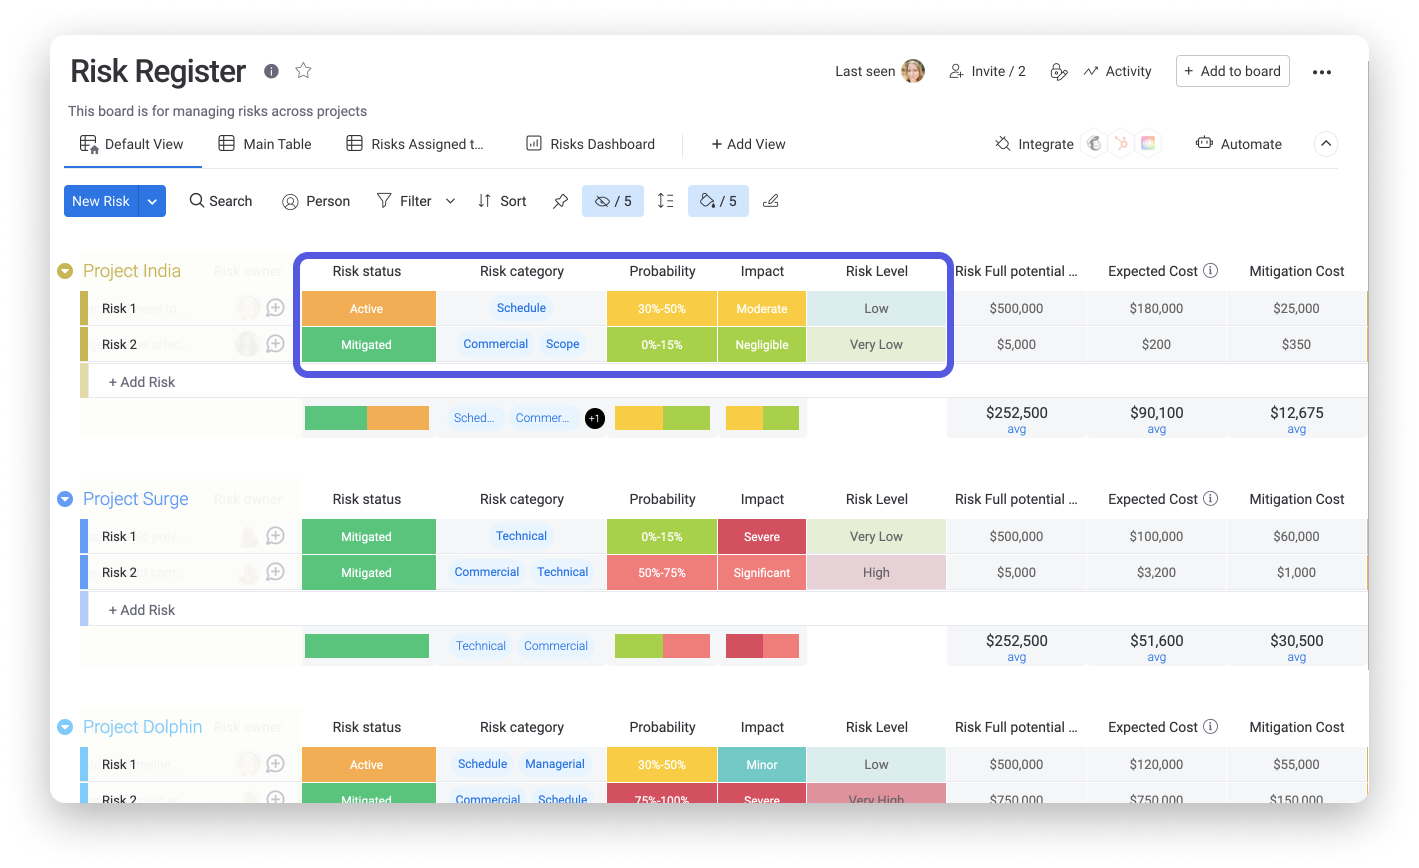
Once the project scores are determined, conditional coloring applies coloring to the cells that meet your defined criteria to visually emphasize and differentiate the different risk levels. For instance, we designated five different colors on the spectrum from green to red depending on the risk level (very low to very high):
Create risk reports using dashboards
Visually analyze data from your board using the Risks Dashboard. Centralize your data in one location and use our widgets to have all the tools and information you need in one view. Your Risks Dashboard serves as a great tool to easily understand different risk metrics at a glance!
If you have any questions, please reach out to our team right here. We’re available 24/7 and happy to help.
Comments