


 7 min read
 Guide
Guide
A developer console is a tool that logs information about the backend operations of the sites you visit and applications you run. The information logged in the console can help our developers to solve any issue that you may experience.
If you've been asked to provide a screenshot of your developer console, scroll down to find instructions for the browser or application you're using.
Chrome
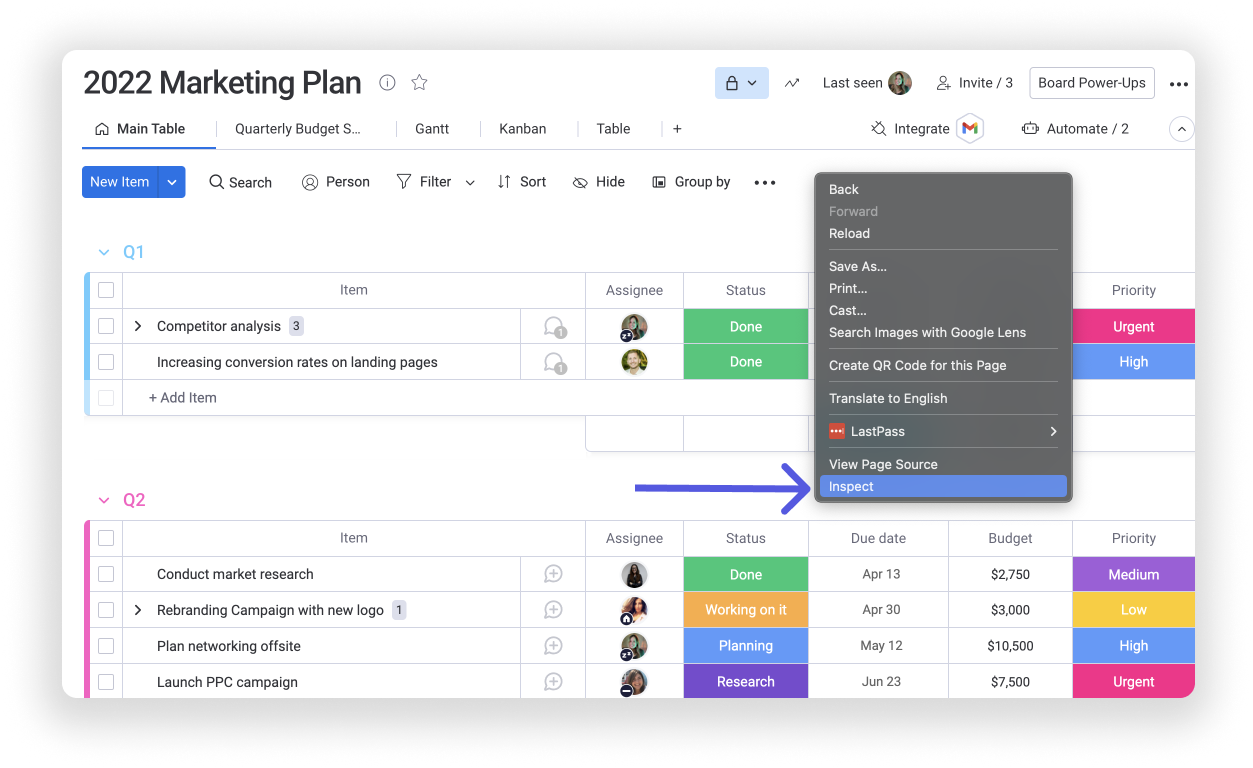
- Step 1: To open the console in Chrome, use this keyboard shortcut: "Cmd + Option + J" (on a Mac) or "Ctrl +Shift +J" (on Windows). As an alternative, you can right-click on the webpage and click "Inspect" to open the developer console.
- Step 2: Click the "Console" tab in that window.
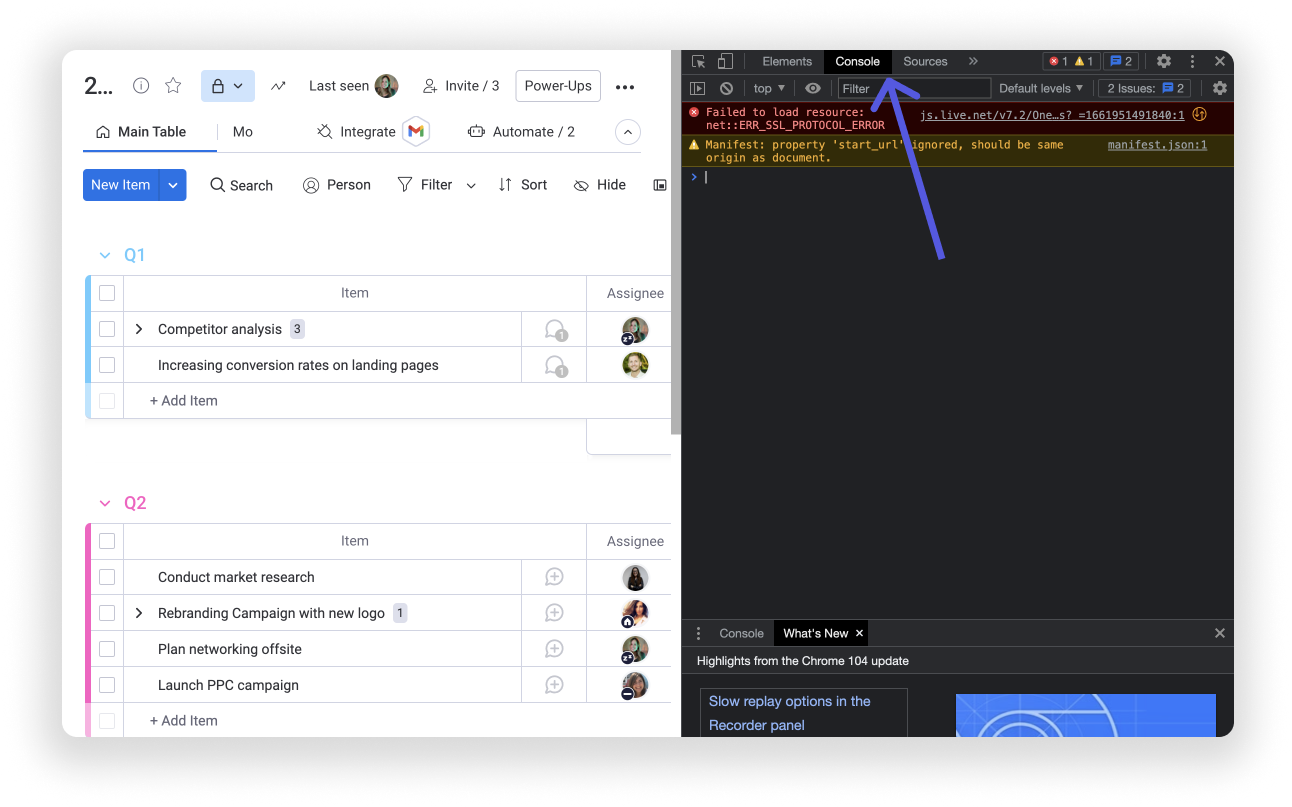
- Step 3: From there, repeat the action that is causing you trouble and take a full screenshot of the Console dialogue.
Firefox
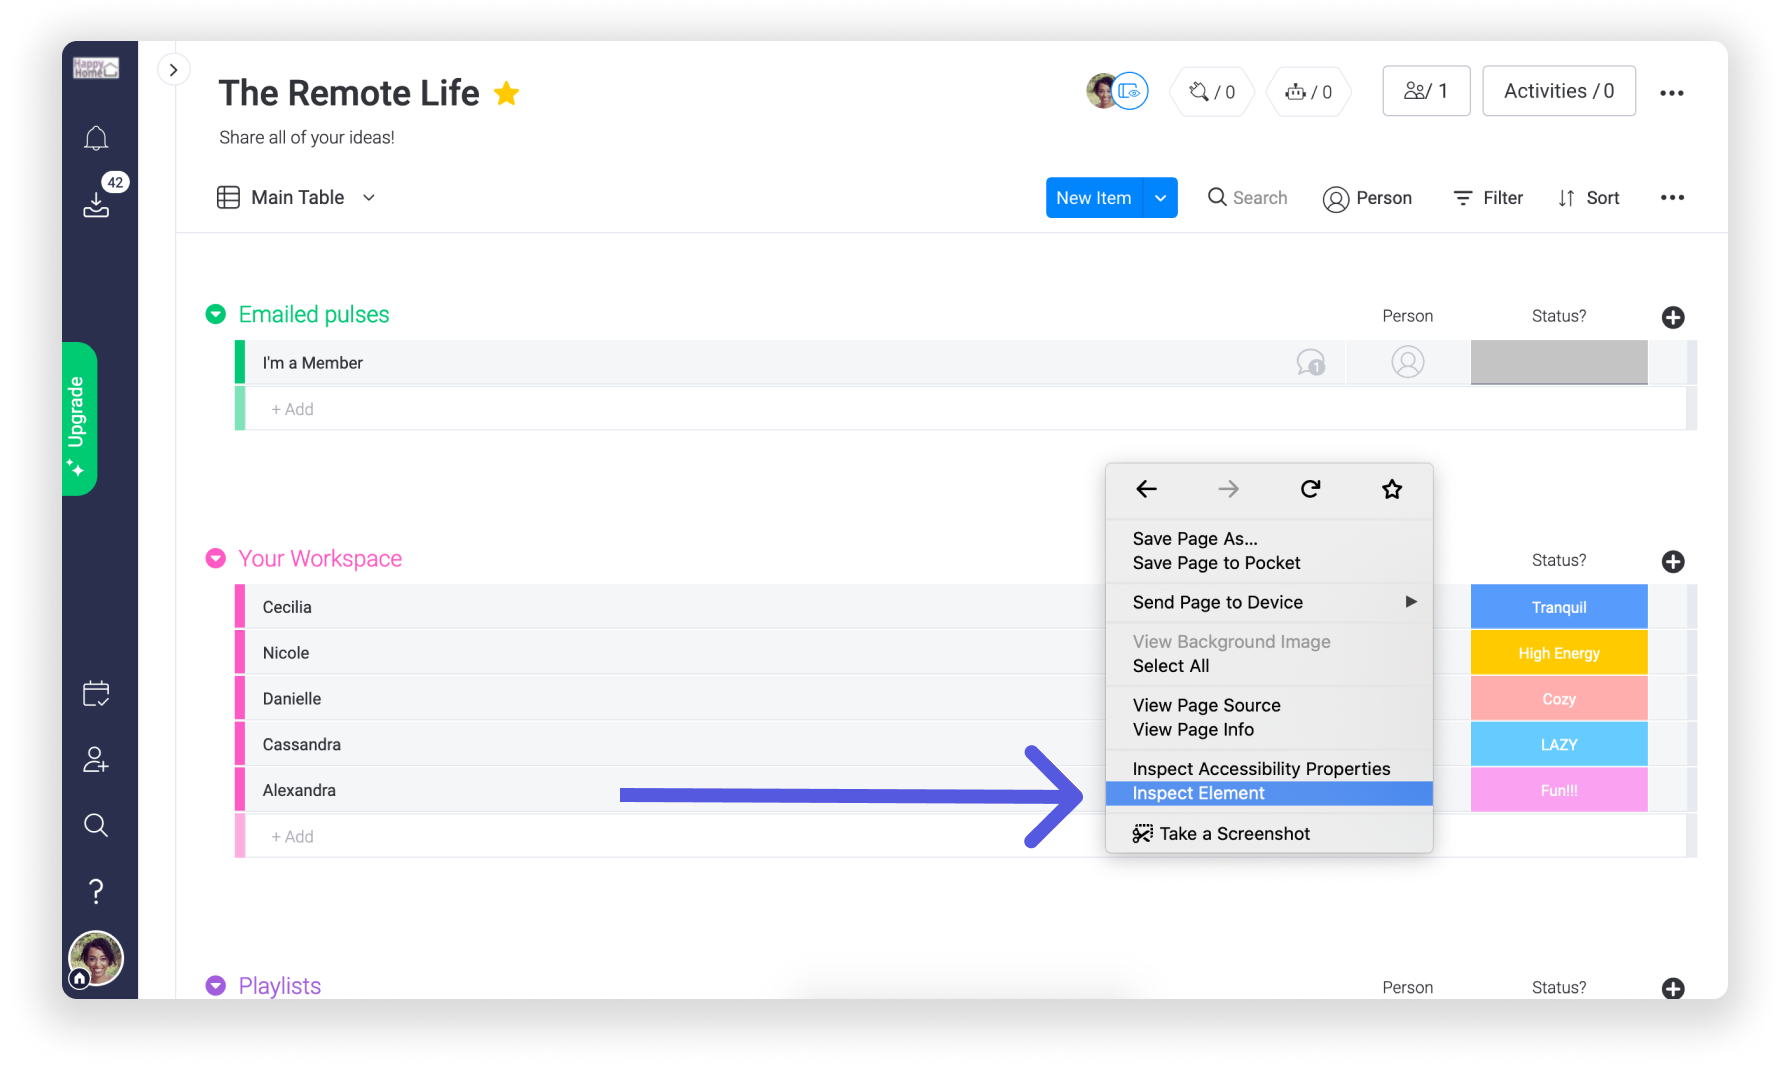
- Step 1: To open the console in Firefox, use this keyboard shortcut: Cmd + Option +K (on a Mac) or Ctrl +Shift +J (on Windows). As an alternative, you can right-click on the webpage and click "Inspect Element" to show the developer window.
- Step 2: Select the "Console" tab in that window.
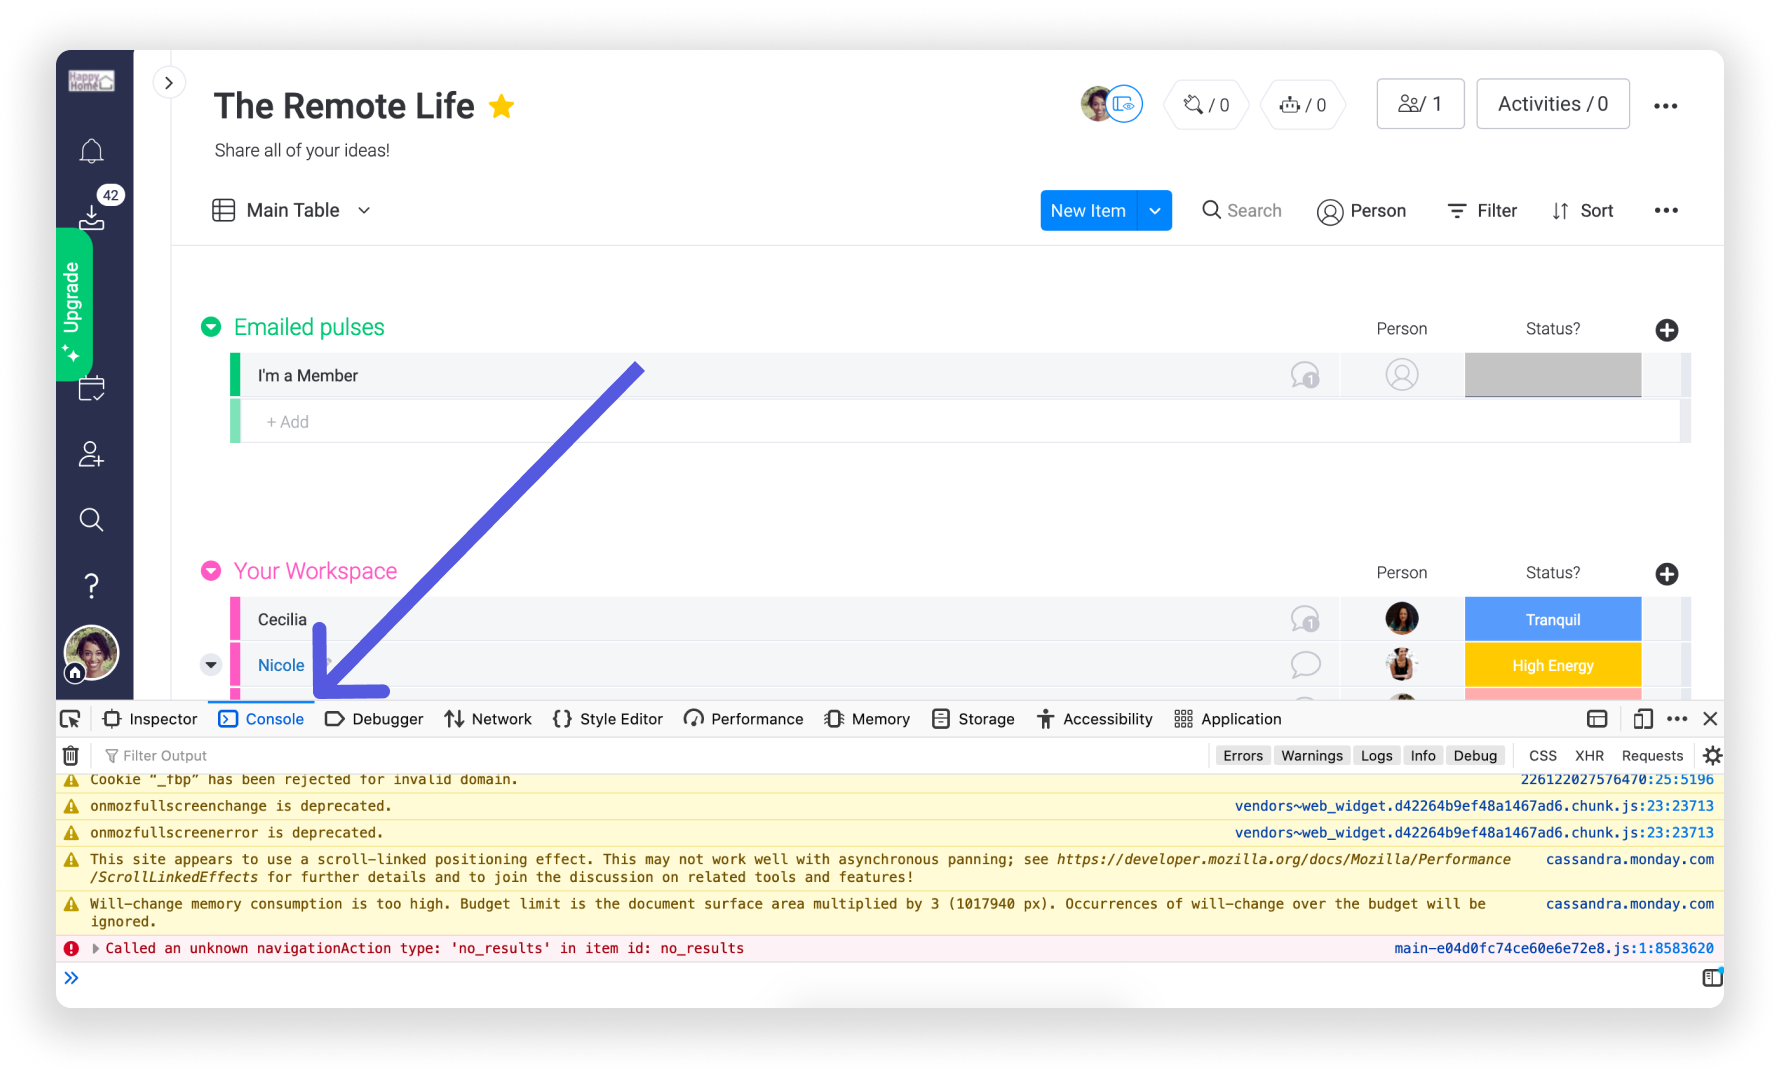
- Step 3: From there, repeat the action that is causing you trouble and take a screenshot of the full Console dialogue.
Safari
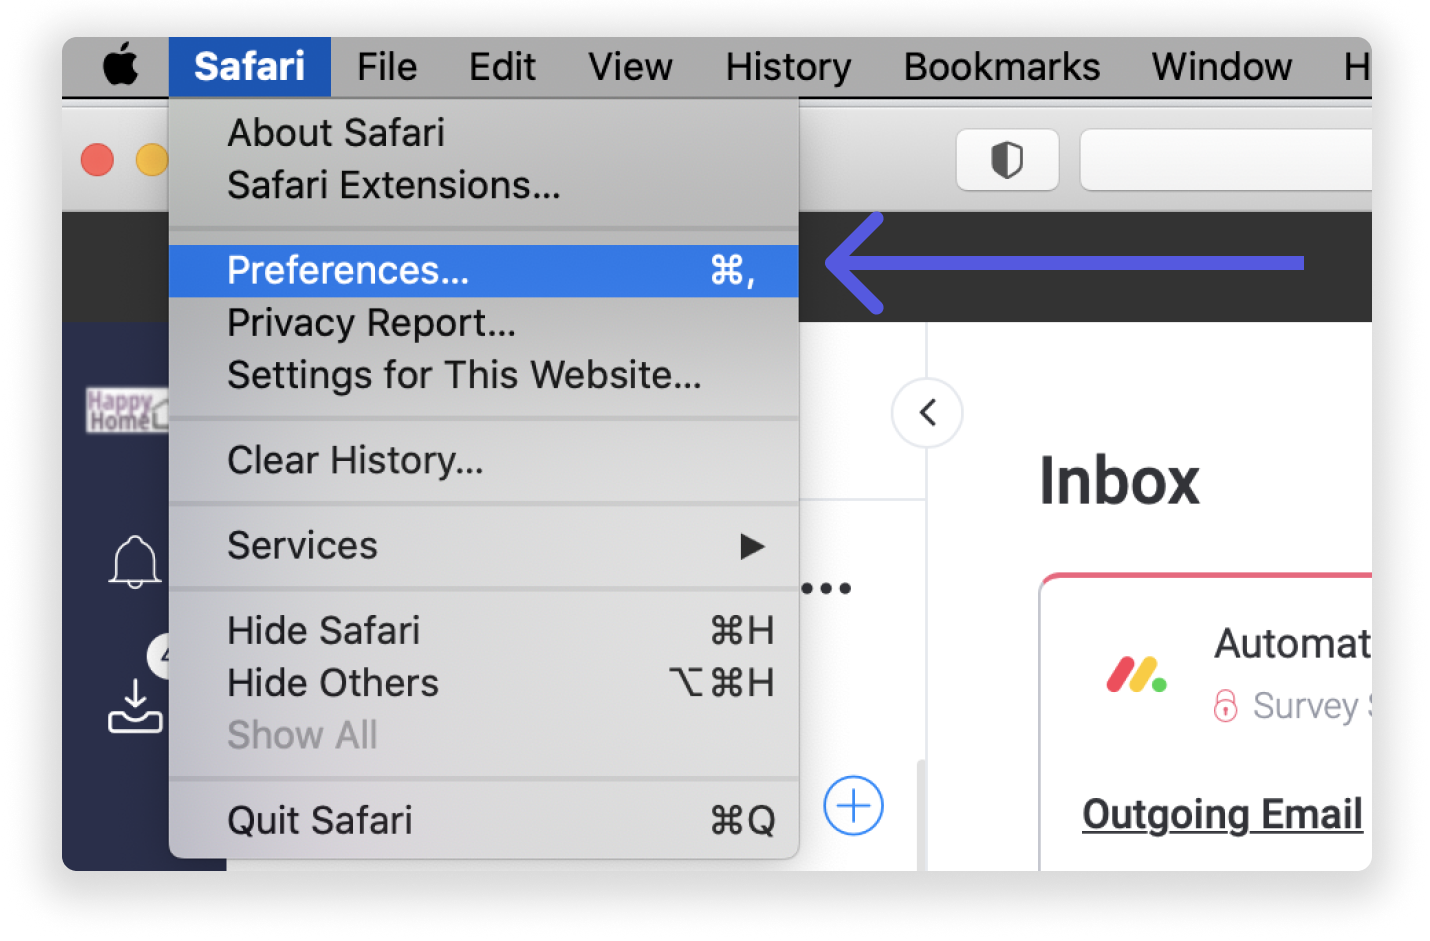
- Step 1: To open the console in Safari, you must first enable the "Develop menu" in the Mac menu bar. To do this, go to Safari in the Mac menu bar at the top of your screen and then select "Preferences."
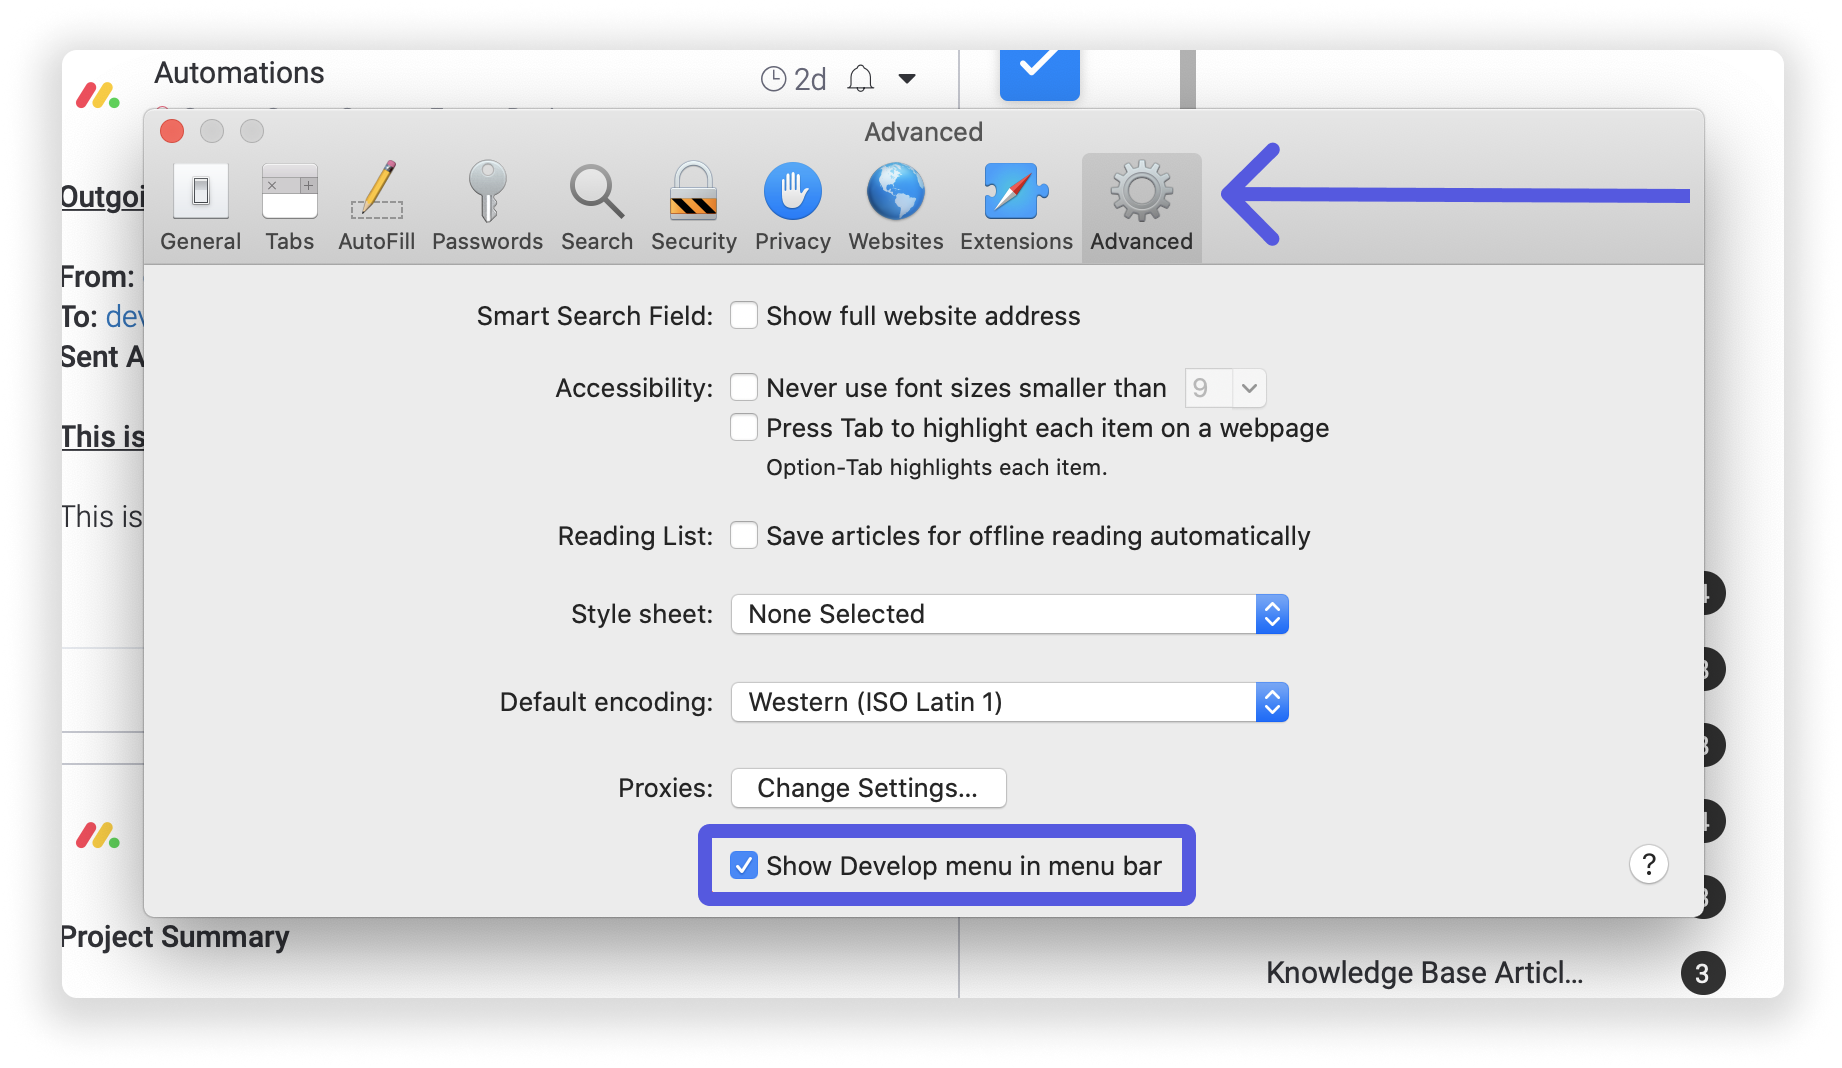
- Step 2: Once you have the Preferences Dialog box open, click on "Advanced" at the top and then tick the checkbox next to "Show Develop menu in menu bar." You can then exit the window.
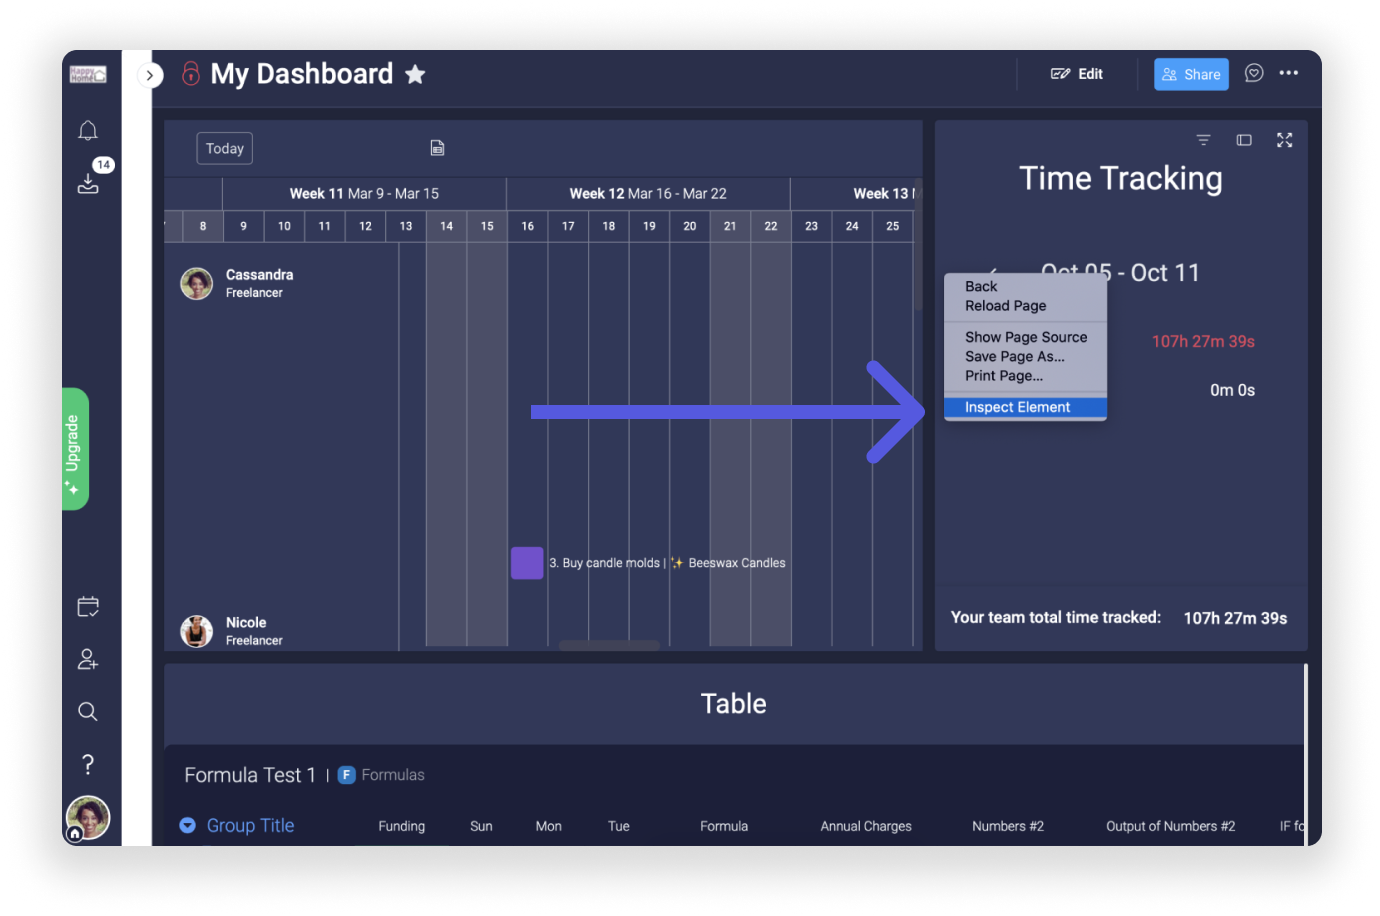
- Step 3: To open the console, you can use this keyboard shortcut: Cmd + Option + C. As an alternative, you can right-click on the webpage and click "Inspect Element", and the developer window will appear.
- Step 4: In the window that opens, click the "Console" tab.
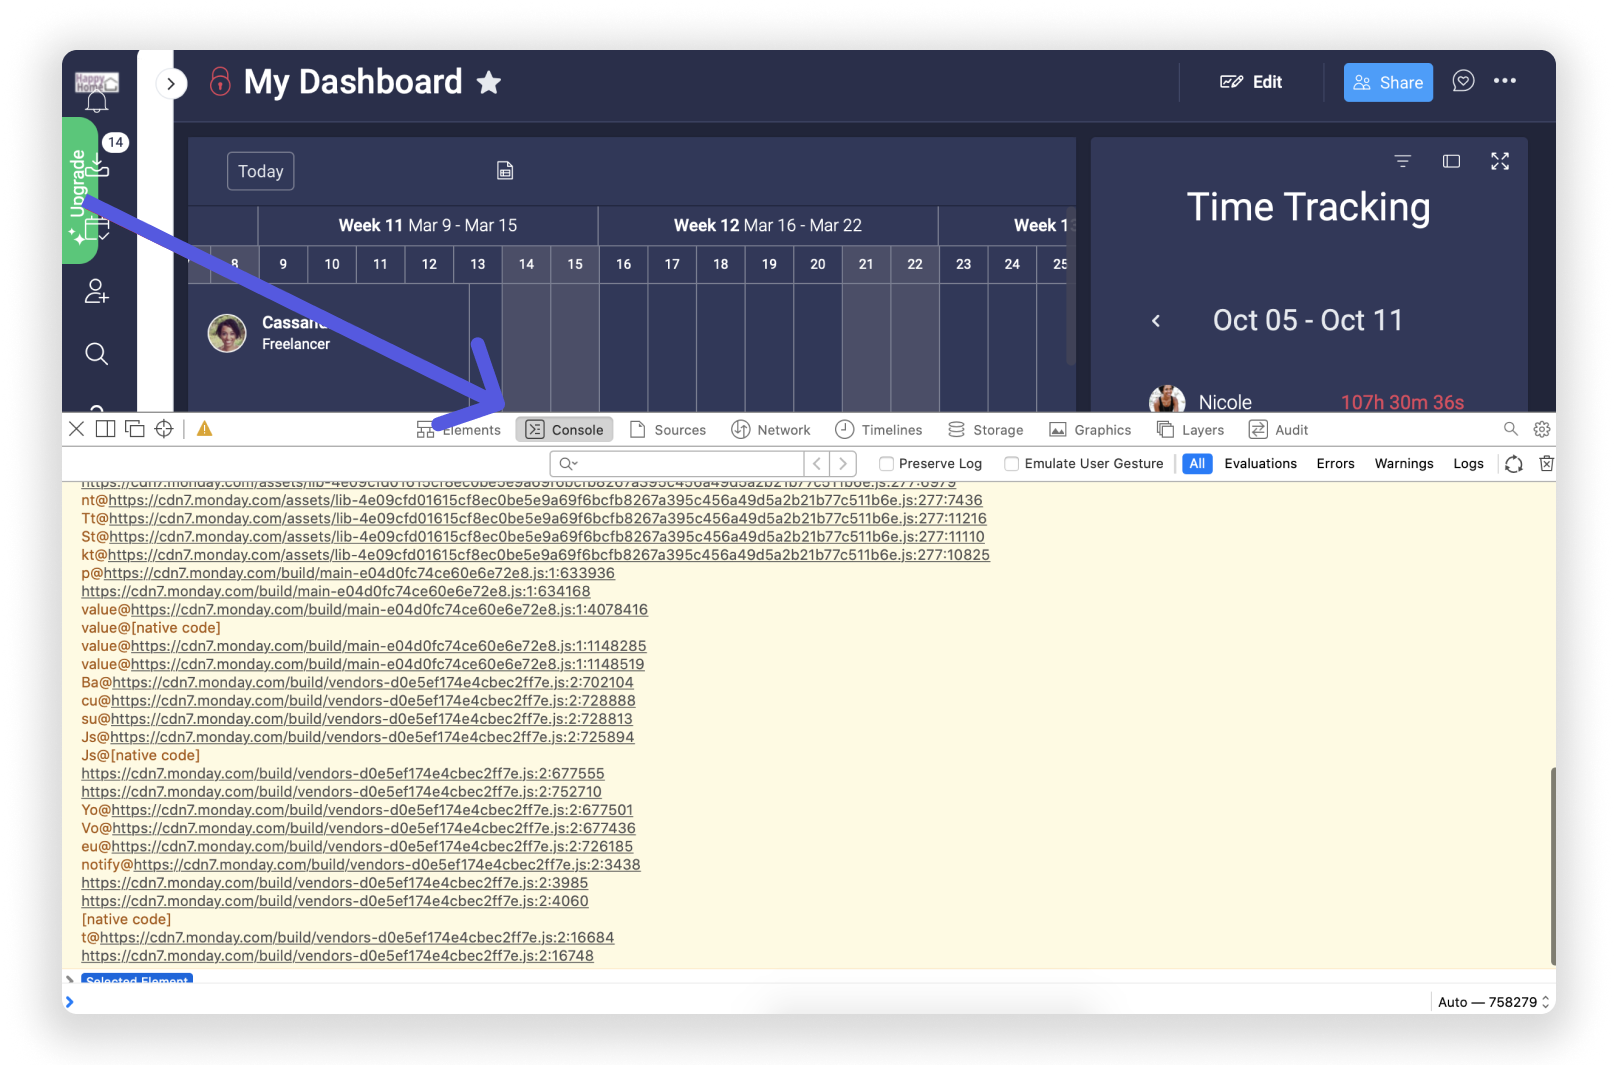
- Step 5: From there, repeat the action that is causing you trouble and take a screenshot of the full Console dialogue.
Microsoft Edge
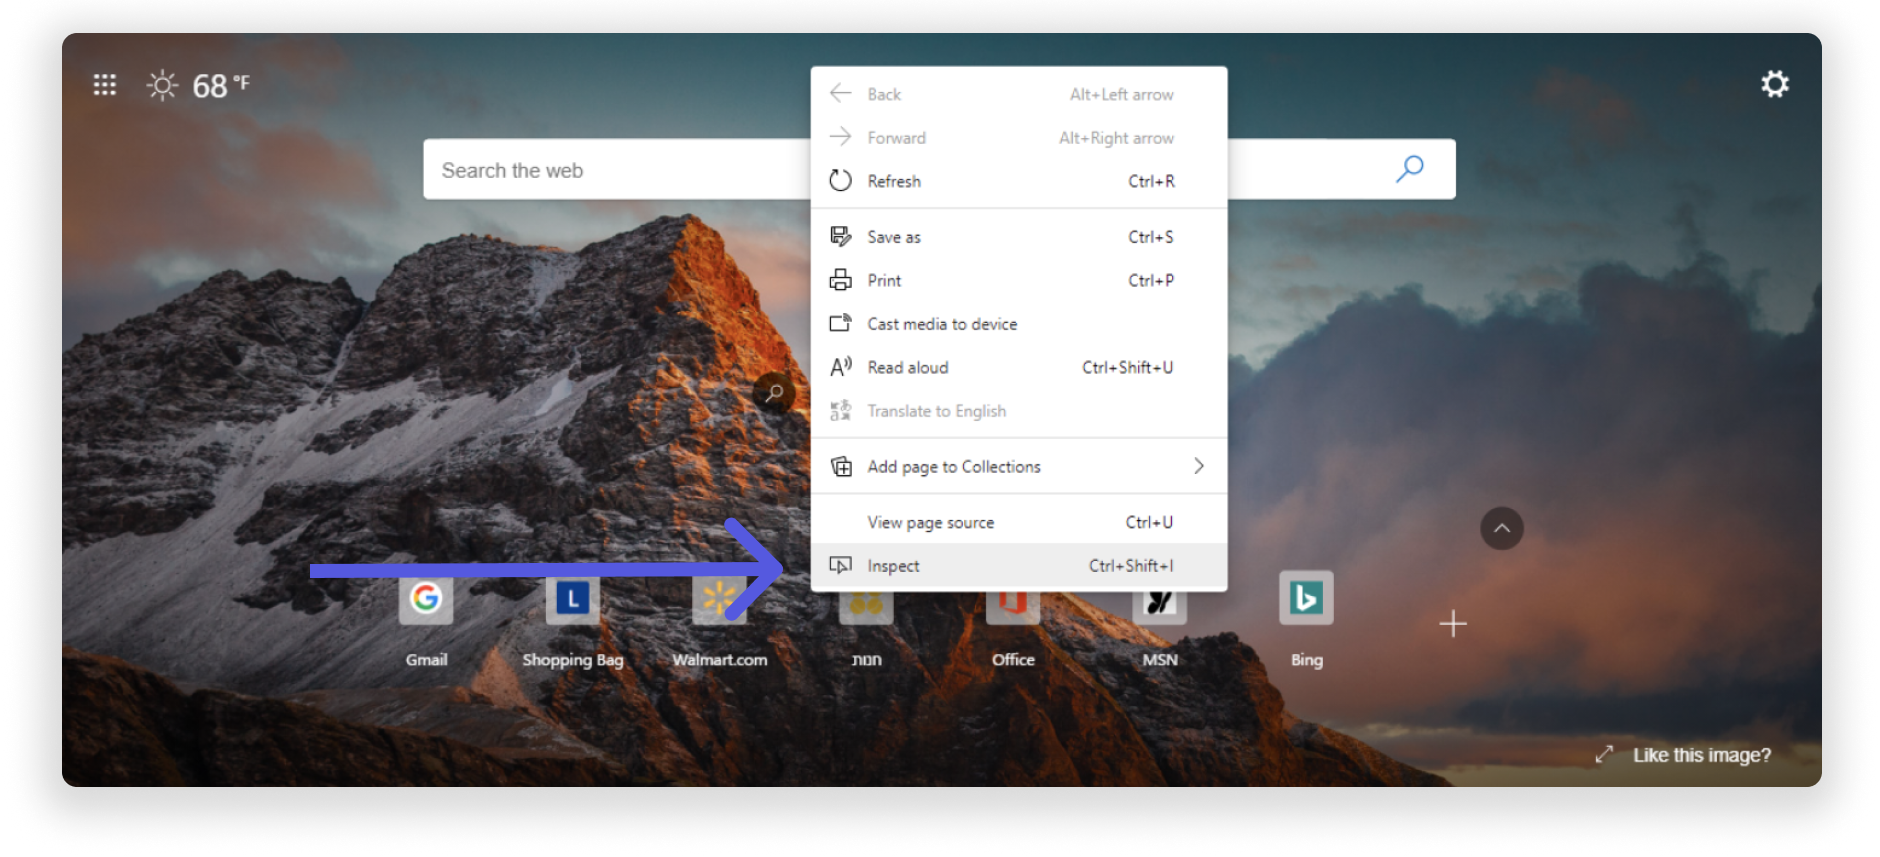
- Step 1: To open the console in Microsoft Edge, you can use the following shortcut: Control + Shift + I. As an alternative, you can right-click and select Inspect from the menu:
- Step 2: In the window that opens, click the "Console" tab.
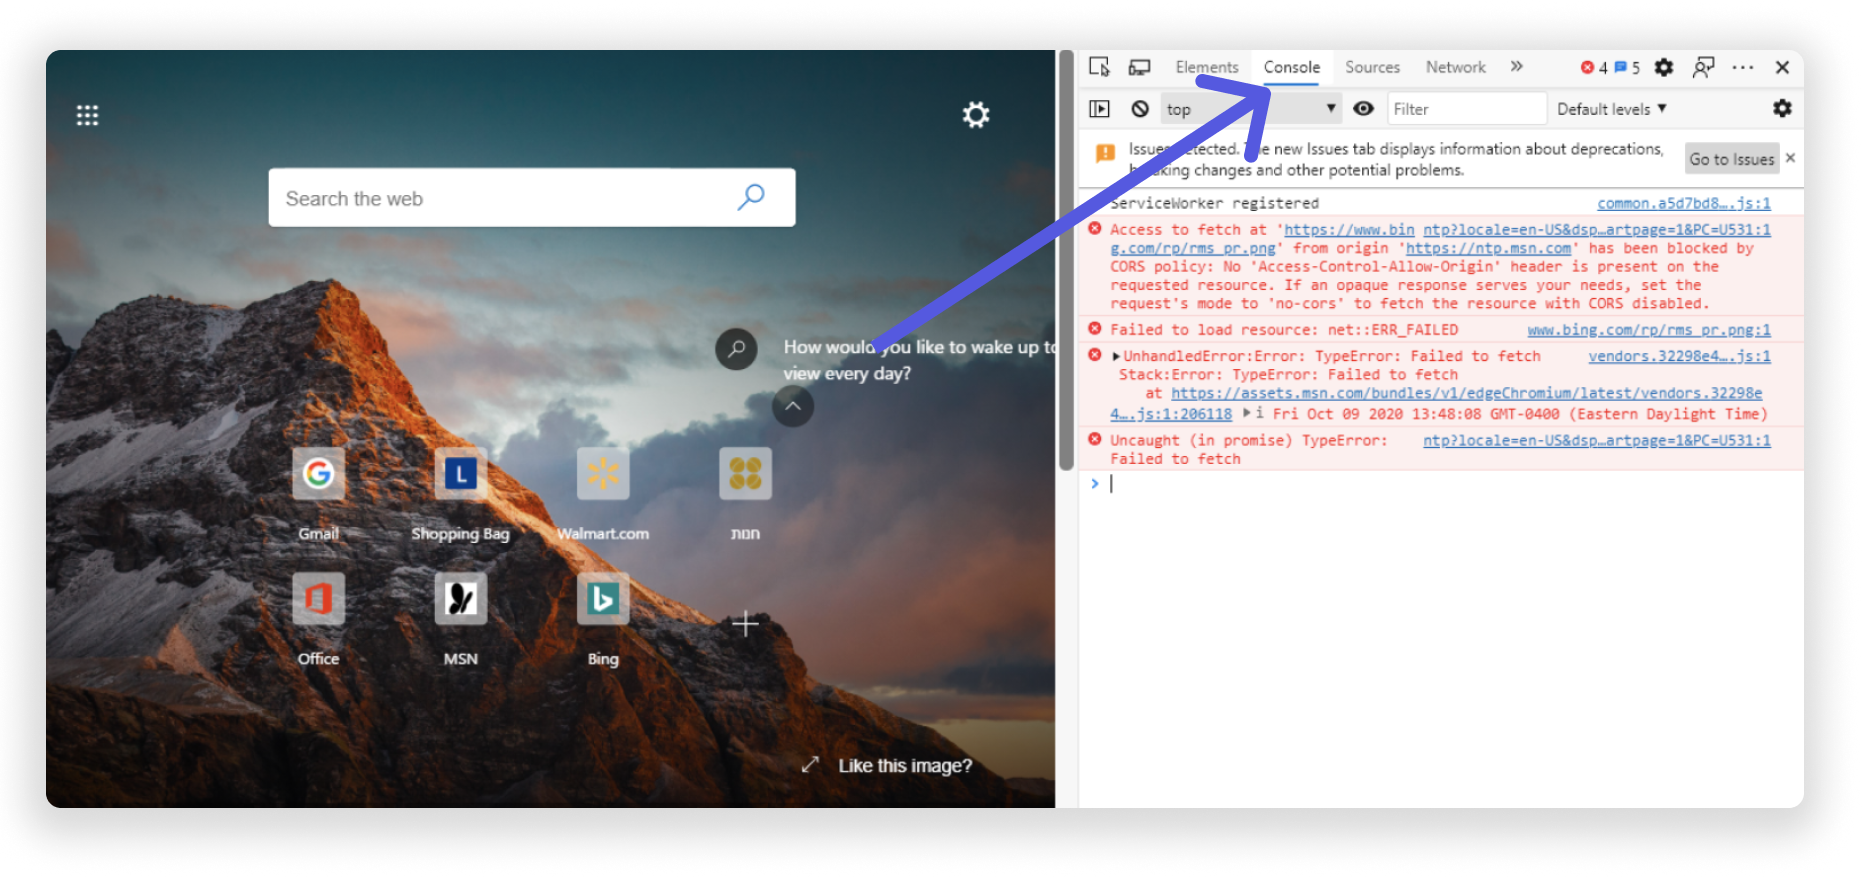
- Step 3: From there, repeat the action that is causing you trouble and take a screenshot of the full Console dialogue.
Desktop App
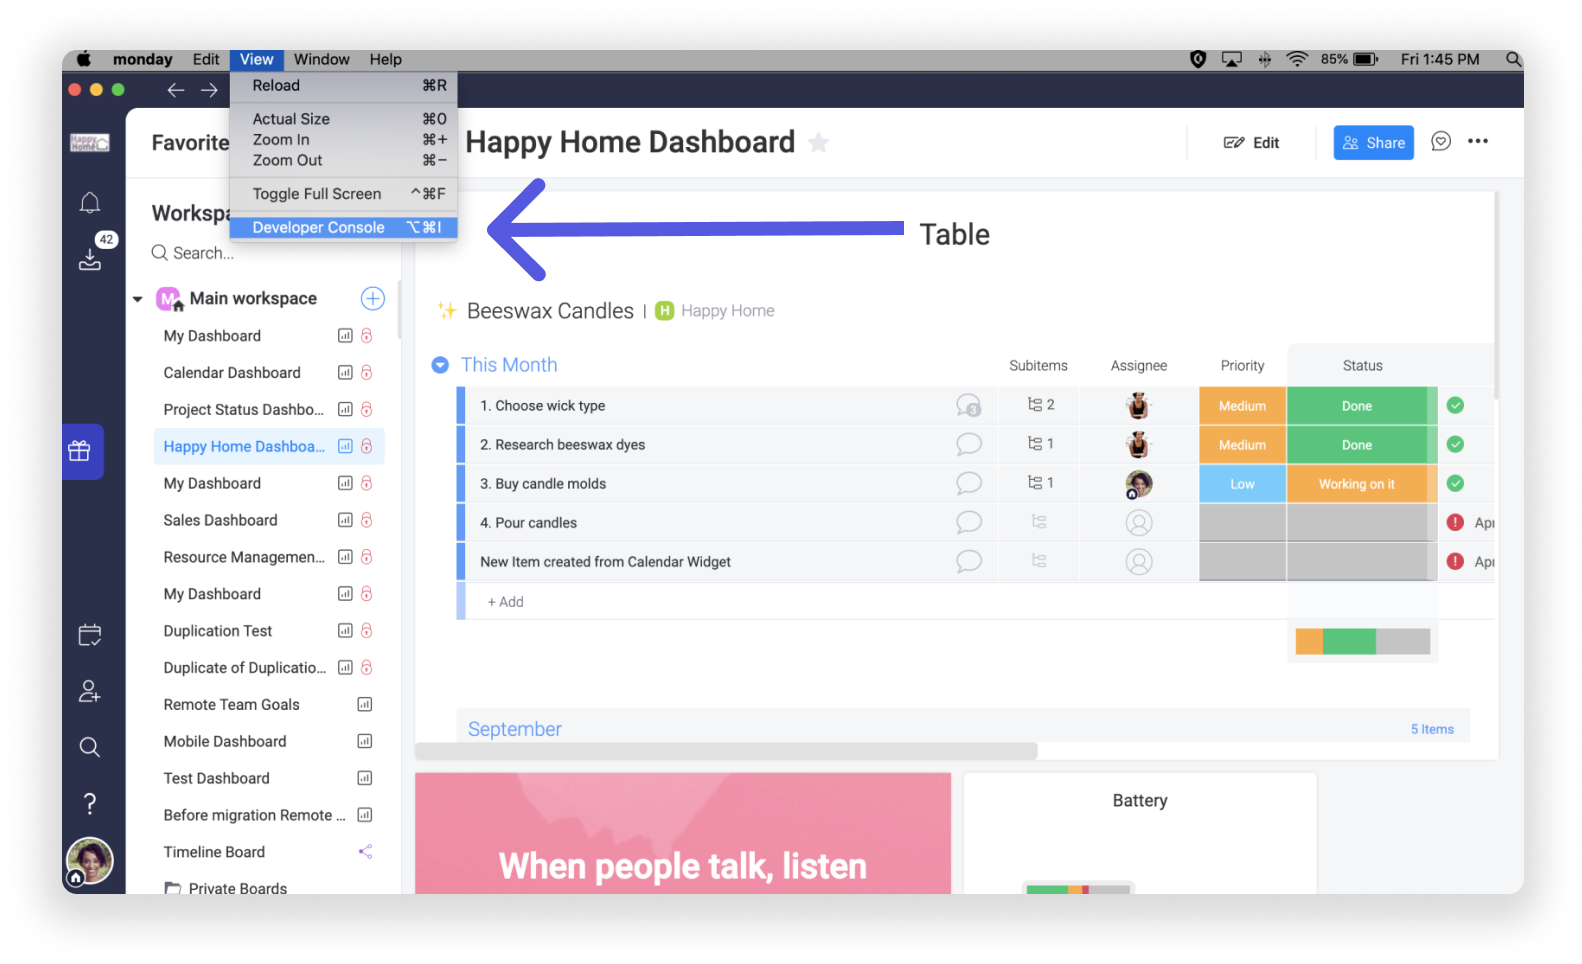
- Step 1: To open the console in the monday.com Desktop App, you can select "Developer Console" from the View menu on your toolbar.
- Step 2: The console will open in the main application window. However, a new window may open as well. In either window, click the "Console" tab.
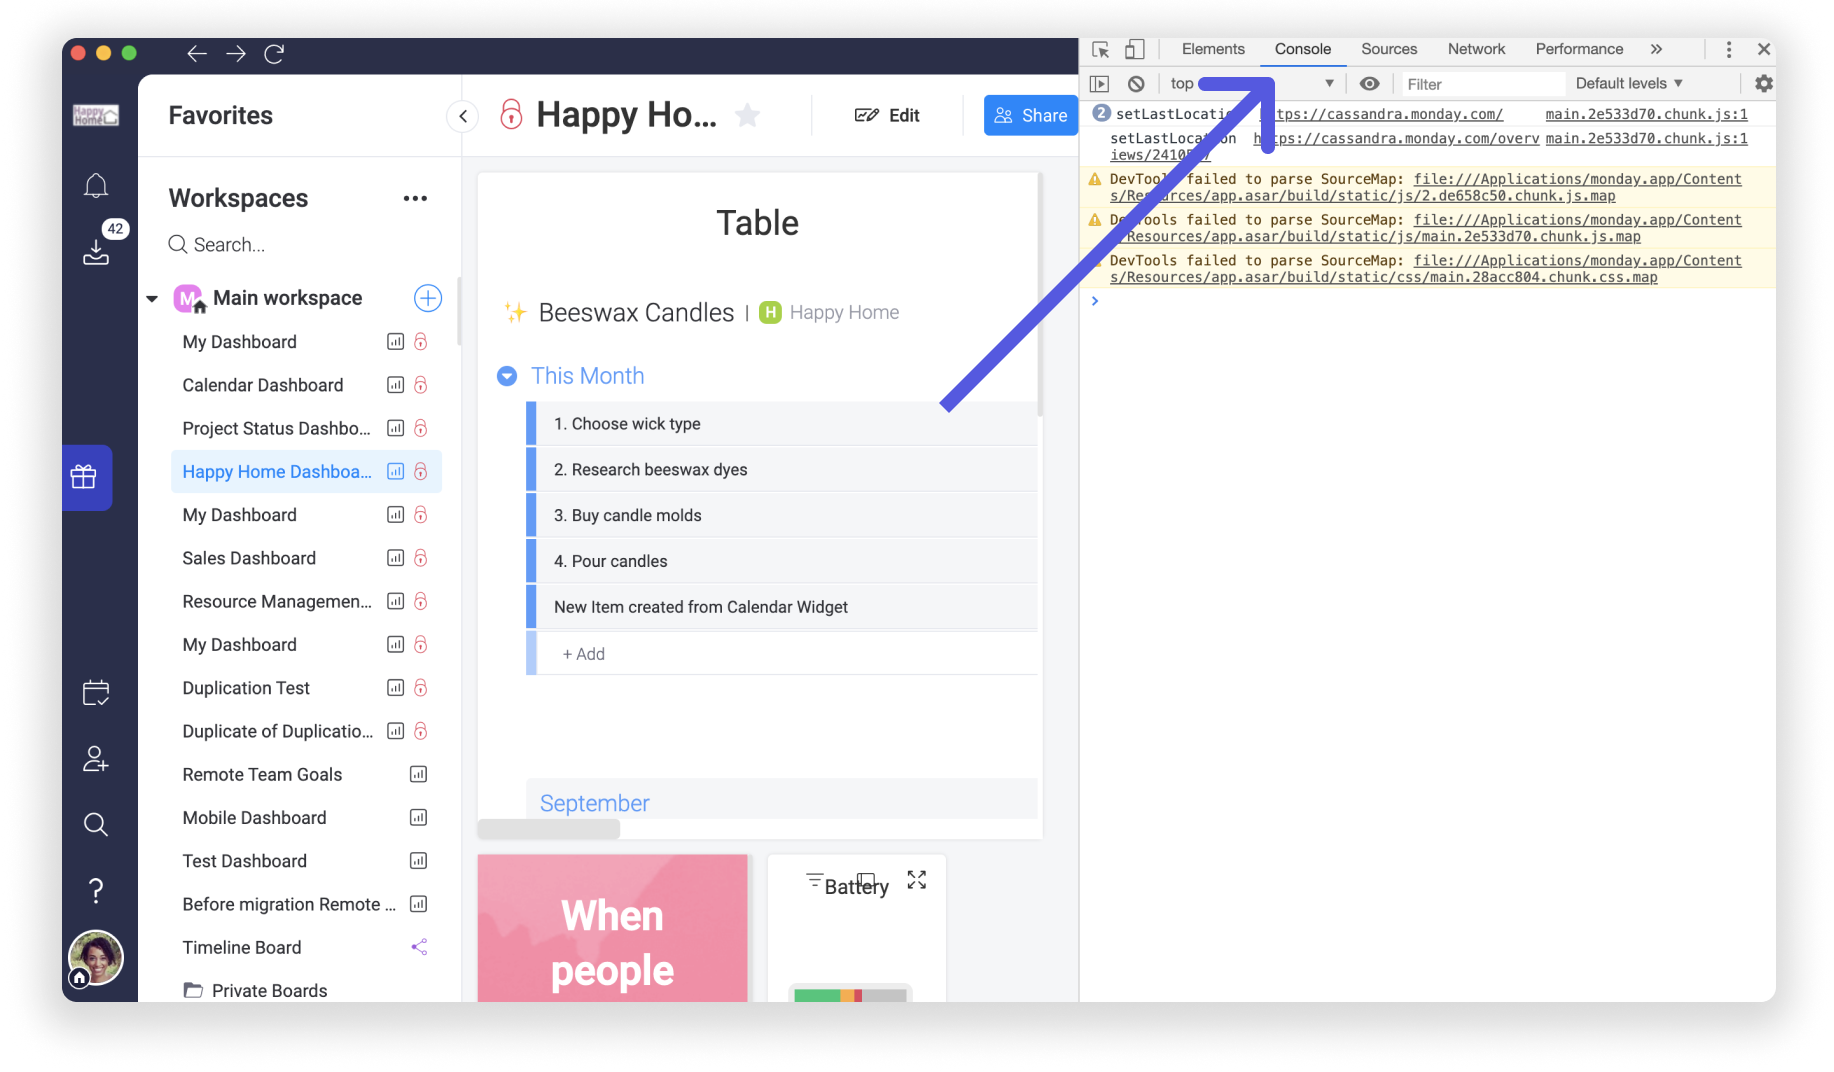
- Step 3: From there, repeat the action that is causing you trouble and take a screenshot of the full Console dialogue.
If you have any questions, please reach out to our team right here. We’re available 24/7 and happy to help.
Comments