


 7 min read
 Guide
Guide
With orders constantly flowing in, it can be difficult to coordinate between your inventory and your orders. It's important to track purchases to make sure that your products are ordered accordingly and your inventory is always appropriately stocked!
That's why we've created a few templates to help you stay on top of your orders and inventory with monday.com! Read on to learn more about managing orders and sales using monday.com. 🙌
Track incoming orders
Our hat company, "Mad Hatter Co." produces and sells a wide range of hats in different styles, materials, and colors! To keep track of our orders, we've created a form-powered board where each item is a different order, the columns outline the hat type, style, and color, and more, while the groups are organized according to the order status.

Each item is generated using a WorkForm, which is filled out by the customer. Using the form, they fill in their first and last name, which is then translated into the item's name, and the hat type, style, and color that they would like to order, which is then translated into the various Status Columns in our board. They are then given the option to leave a comment, which will appear as an update in the item.
The rest of the fields in our board are hidden in the form so that we can fill them in manually after the item is created. We use automations to fill in the day that the item is created, as well as to move our items through the groups in our board.
Update automatically
Rather than having to calculate figures or move items around our board manually, we've added a few automations to take care of those things for us!
- Set dates
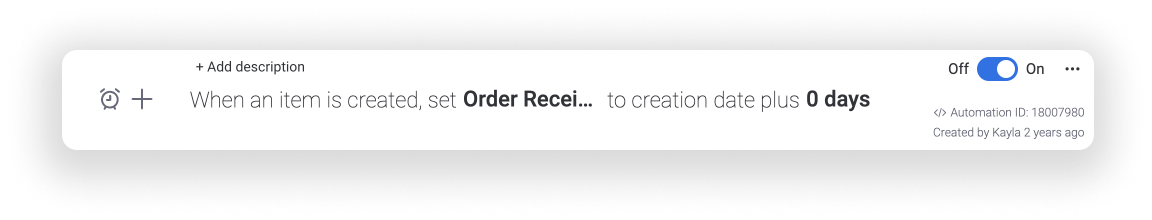
Since all new items are added through our order form, rather than being inputted manually, we've added the following automation to make sure that the date that the order is received is always accurate! This automation sets the "Order Received" date to the day that the item is created!
- Keep things moving
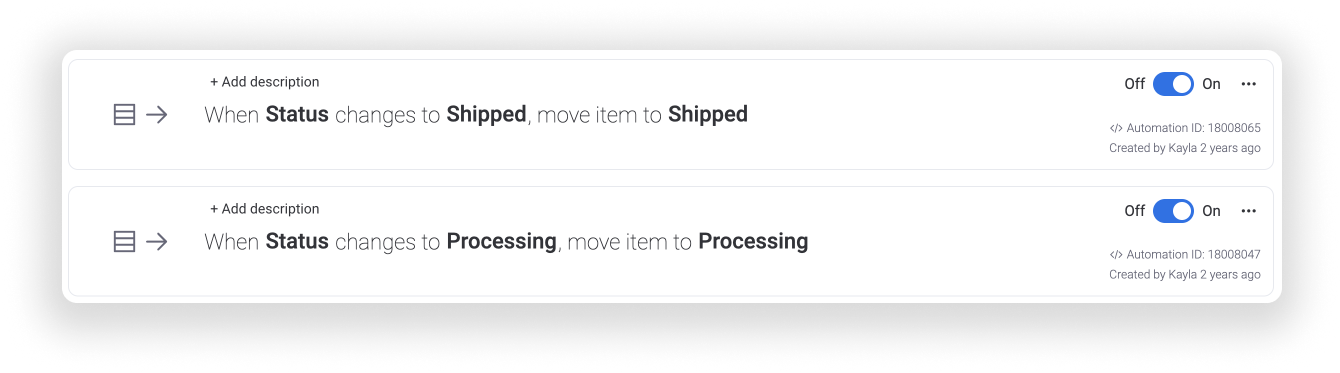
Our board is organized into groups that represent stages of preparedness for shipping. Rather than having to manually move items to the appropriate group when the order's status changes, we use automations!
- Stay in the know
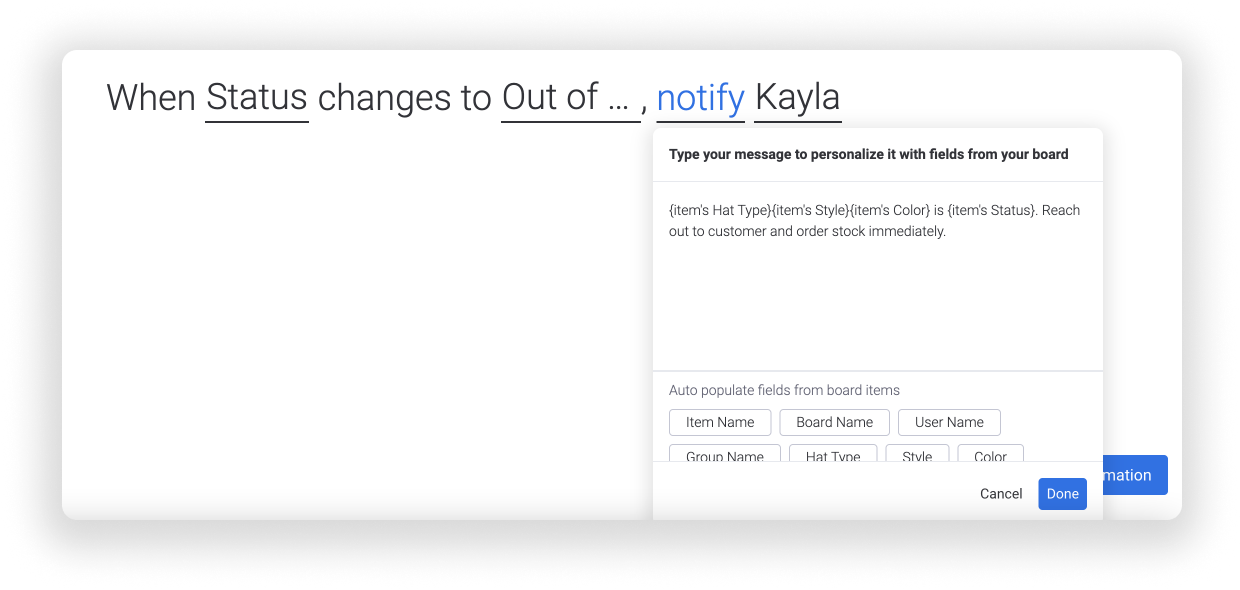
If we ever run out of stock while trying to fill an order, we want to deal with the issue right away so that we don't keep our customers waiting too long. For this, we've set the following automation to notify our manager every time an order's status is changed to "Out of Stock".
Using this, we can even customize the message to specify the type, style, and color of the hat that needs to be ordered and even include the name of the customer!
- Calculate hands-off
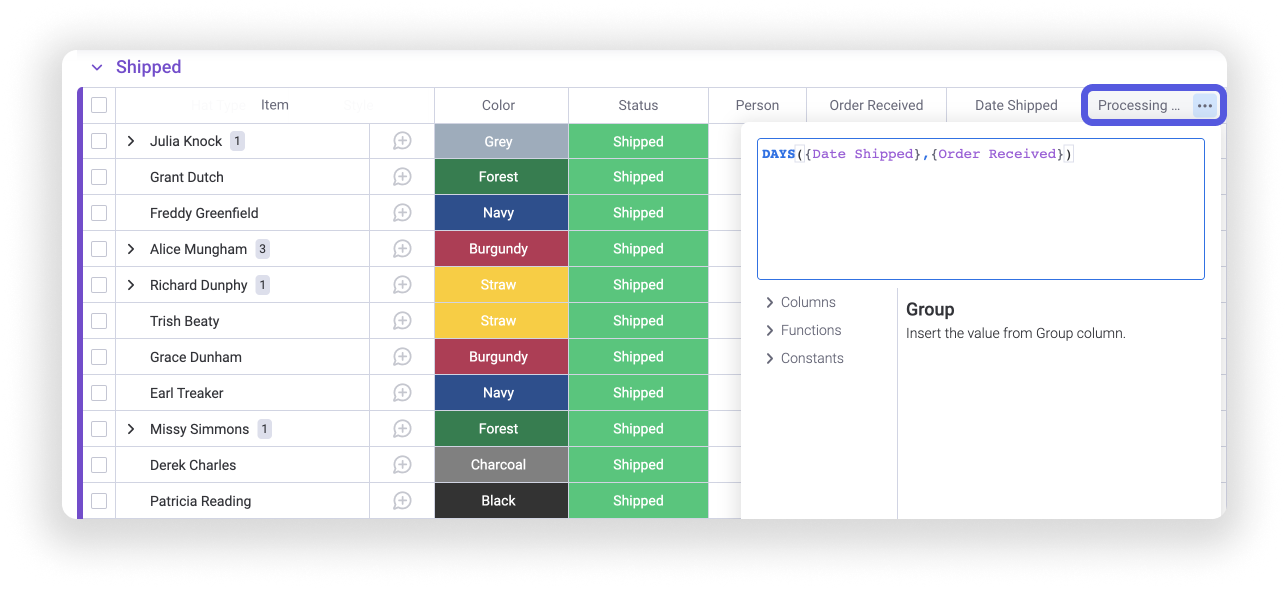
There's no need to calculate figures manually when you can use the Formula Column! We track the date of every order received as well as the date we ship out all orders. It's really important for us to keep the window between these dates as small as possible, so we've added the following formula to keep track:
The formula finds the difference between the two dates so that we don't have to! This way, we can scan the "Processing Days" Formula Column to quickly understand how long it takes us to turn out our orders. We've even added a column summary calculating the average number of days we fill orders in!
Integrate emails
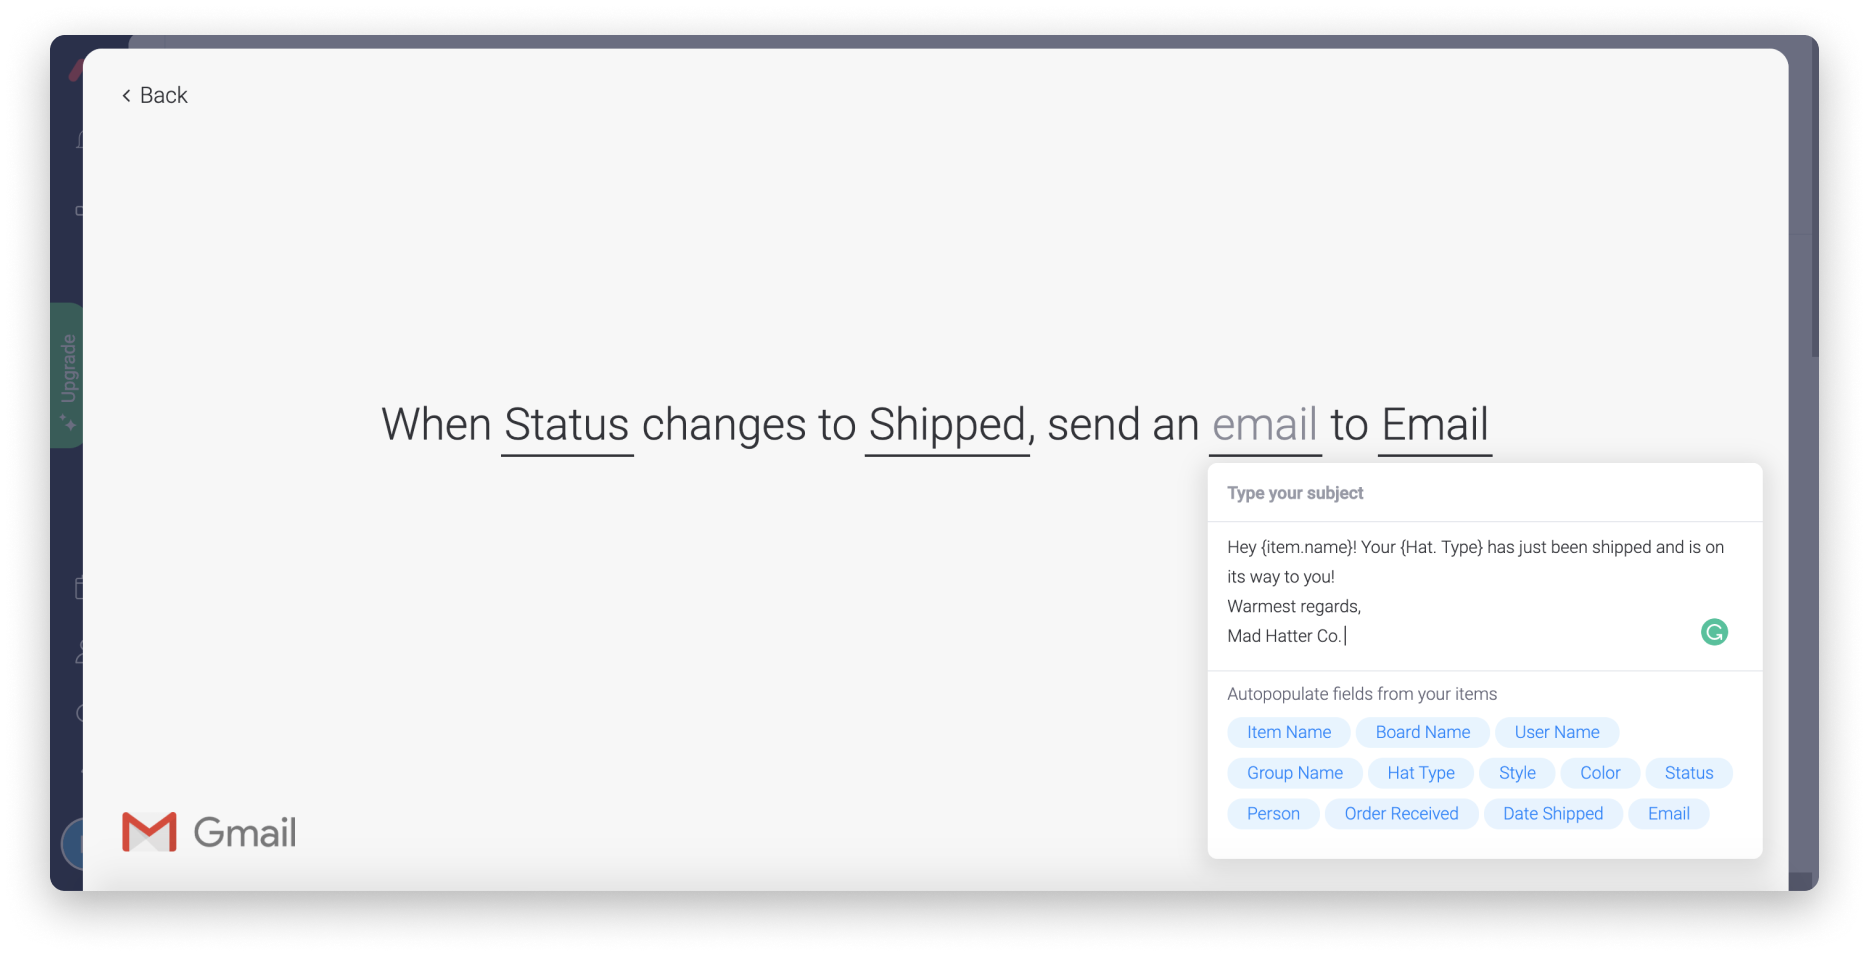
We want our customers to stay in the loop about their orders, but we don't have the time to write emails manually to each customer. To solve this problem, we use the Gmail or Outlook Integration which works with the Email Column we set up earlier in this article! We've added a recipe that automatically sends a pre-composed message every time the order's status is changed to "Shipped".
Keep an eye on your inventory
With orders constantly flowing in, we need a fool-proof way to coordinate between our inventory and our orders. We use a board called "Mad Hatter Inventory" to keep track of how much inventory we have so that we always stay fully stocked and ready to complete and ship orders.
The board is divided into groups, representing each type of hat, and each item on our board is a different hat style. We then use the various columns across our board to fill out the stock information of each hat style!
Track your order history
While our "Orders" board helps us stay focused on incoming and recent orders and out "Mad Hatter Inventory" board keeps track of all of our current inventory, we need a third board to record past sales and stats! This board tracks all of the stats we need to know about our products' performance, their prices and profits, and updated inventory status.
Skip the calculator
Numbers and statistics are crucial to the success of our business, but we shouldn't have to calculate them all by hand. We can skip the math with some simple formulas using the Formula Column! Let's take a look at a few formulas:
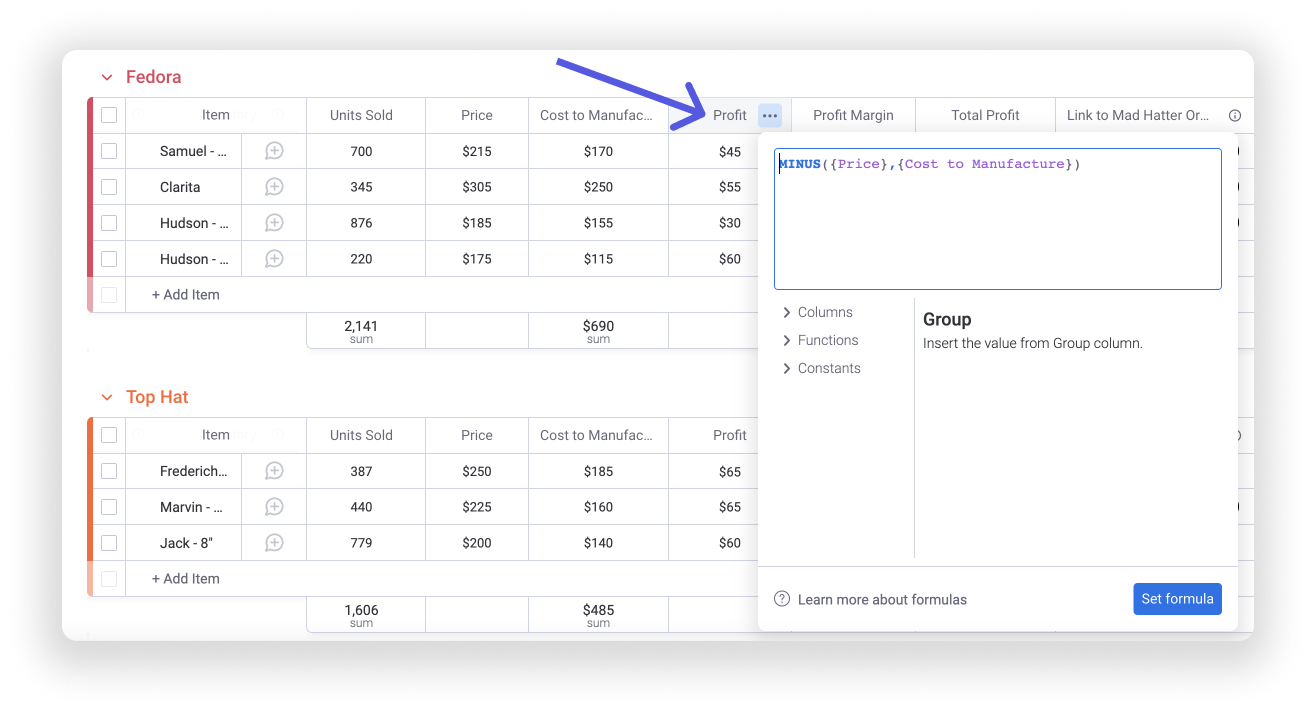
- Calculate Profit
To calculate the profit we make on each hat, we've added this formula, subtracting the "Cost to Manufacture" Numbers Column from the "Price" Numbers Column:
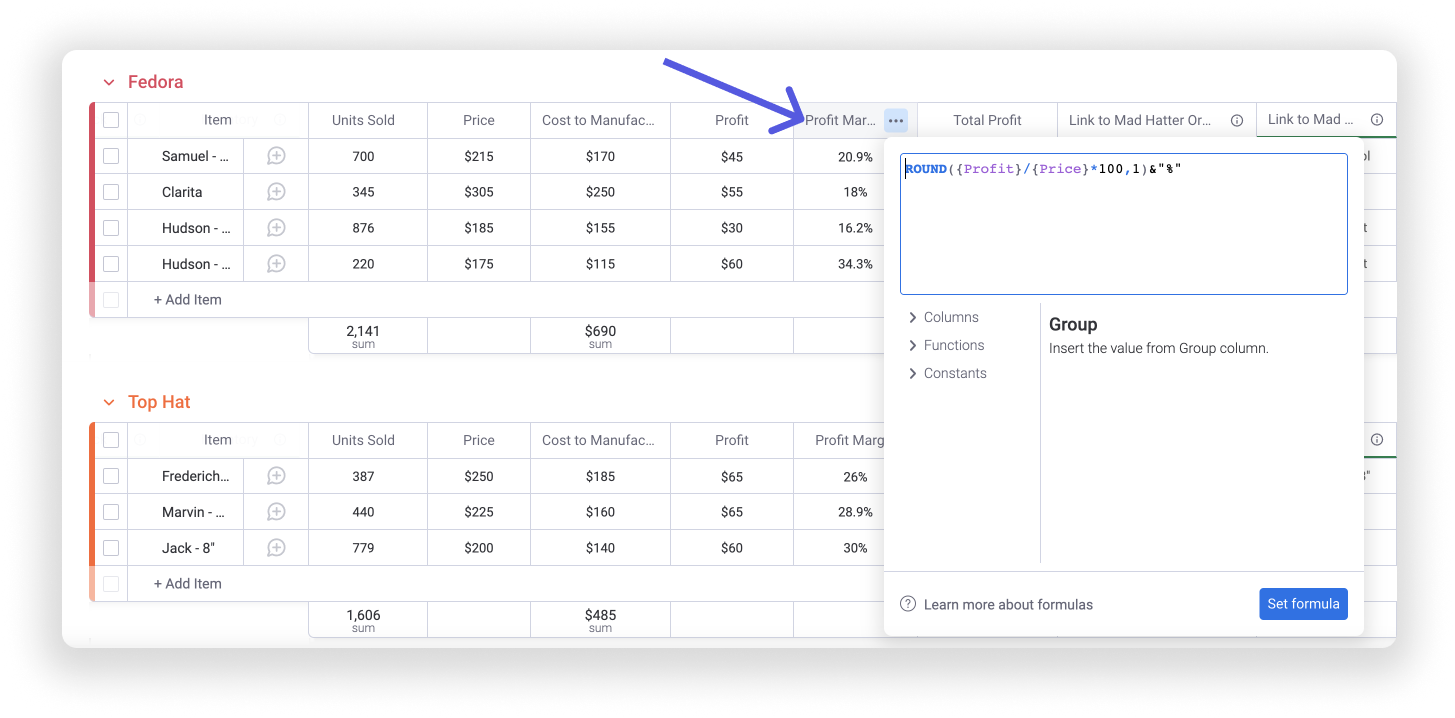
- Calculate Profit Margin
To calculate the profit margin of each product, we used the following formula, deriving the percentage from the "Profit" Numbers Column using the "Price" Numbers Column:
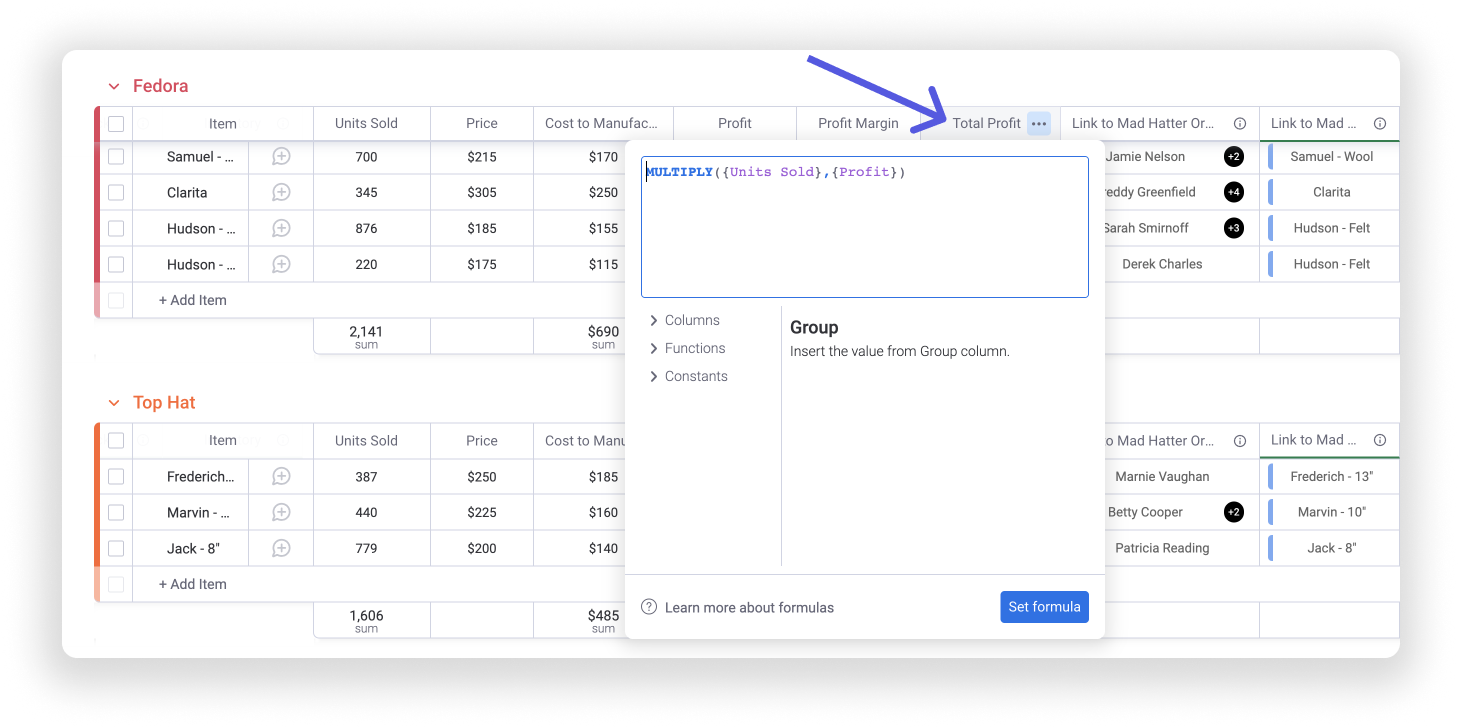
- Calculate Total Profit
To calculate the total profit of each product over time, we used the following formula, multiplying the "Profit" Numbers Column with the "Units Sold" Numbers Column:
Connect your boards
In order to keep data saved in other boards current and in tune across our company, we use the Connect Boards and Mirror Columns! We use one Connect Boards Column to link each current order from our "Mad Hatter Orders" form to the master item in our "Mad Hatter Order History" board. We use another Connect Boards Column to link each product in our master list to the same product in our "Mad Hatter Inventory" board.
Furthermore, when we hover over the number shown on the right side within the Connect Boards Column, we can see a list of linked items from our other boards. We can even click them to expand the item and view all of its details as they would appear in their origin board!
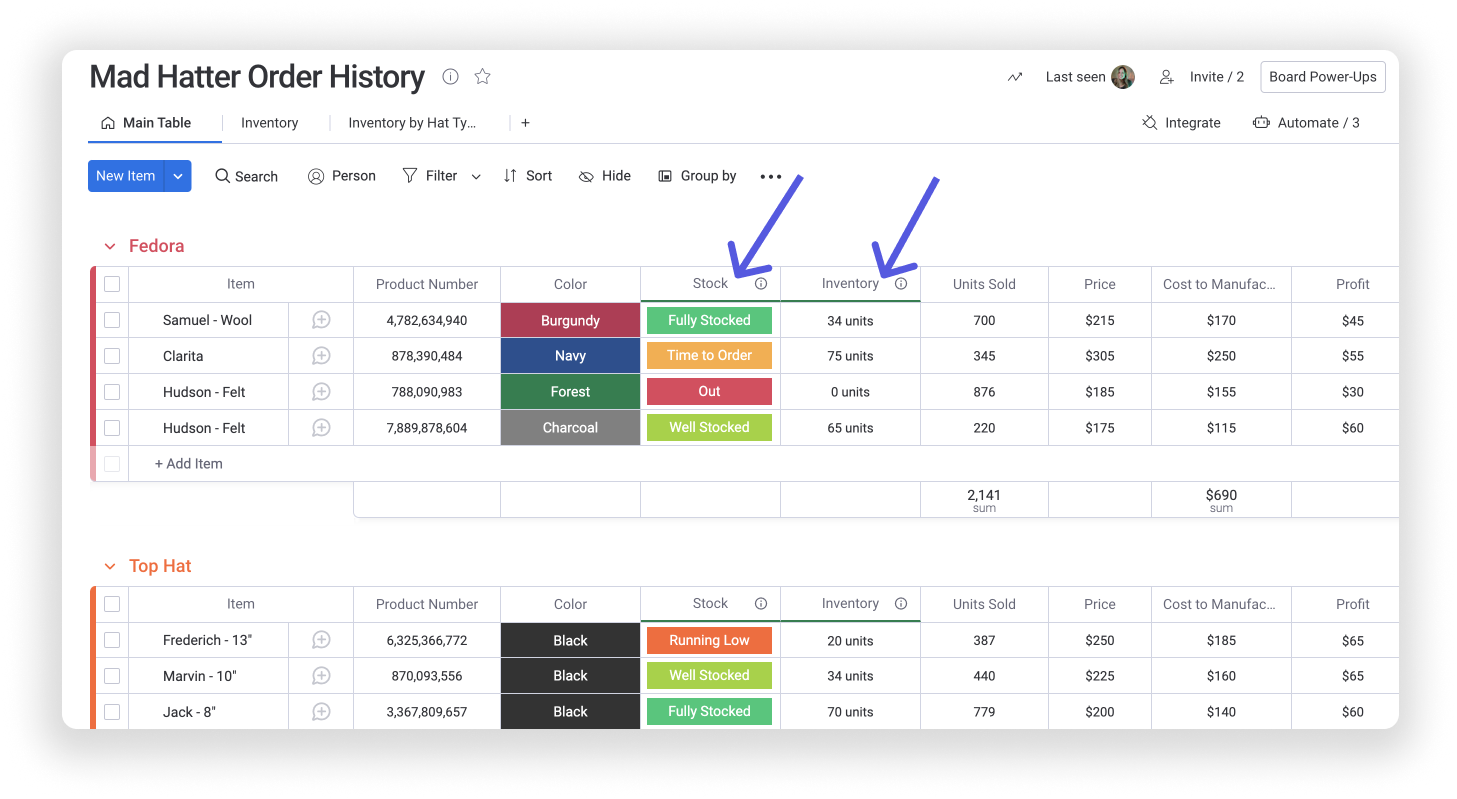
With the Mirror Column, we can reflect a certain column in our linked board exactly how it would appear in its origin board! We use a Mirror Column to reflect the live status of each item's inventory and another Mirror Column to reflect the number of units of each product currently in stock by linking them to our "Mad Hatter Inventory" board using the Link to Item Column.
Add a dashboard!
You can create a dashboard connected to your order and inventory boards (and any other relevant boards) to get a great visual overview of your products and sales loaded with apps and widgets!
Get creative
These three boards are intended to be a starting point to help you translate your workflow into a monday.com workflow! You can use these exact boards in your workflow if they're right for you, but don't be afraid to experiment and test out all of the amazing features on monday.com! Make sure to check out other prepared templates and explore the Columns Center to see all of the ways you can use columns as building blocks to customize your own one-of-a-kind board! You can make your own automations and enable integrations to really connect the dots in your workflow!
If you have any questions, please reach out to our team right here. We’re available 24/7 and happy to help.
Comments