Customer support teams often use different platforms to manage incoming tickets, correspond with clients, and track trends. Being able to consolidate all information into one central work hub can really enhance your workflow! With monday.com’s integrations, you can connect with other platforms to streamline these processes.
Check out some tips and tricks below to see how you can integrate your board with the external ticketing platform Zendesk, track metrics, create reports and help power up your monday.com account for ticket tracking!
Create a board to manage incoming tickets
The Customer Support Ticket Tracking board is super useful to help automatically bring in all incoming tickets into monday.com, allowing you to assign them to a support agent accordingly and track the time they take to get solved. Your tickets will then all be stored in one place for you to refer back to whenever needed!
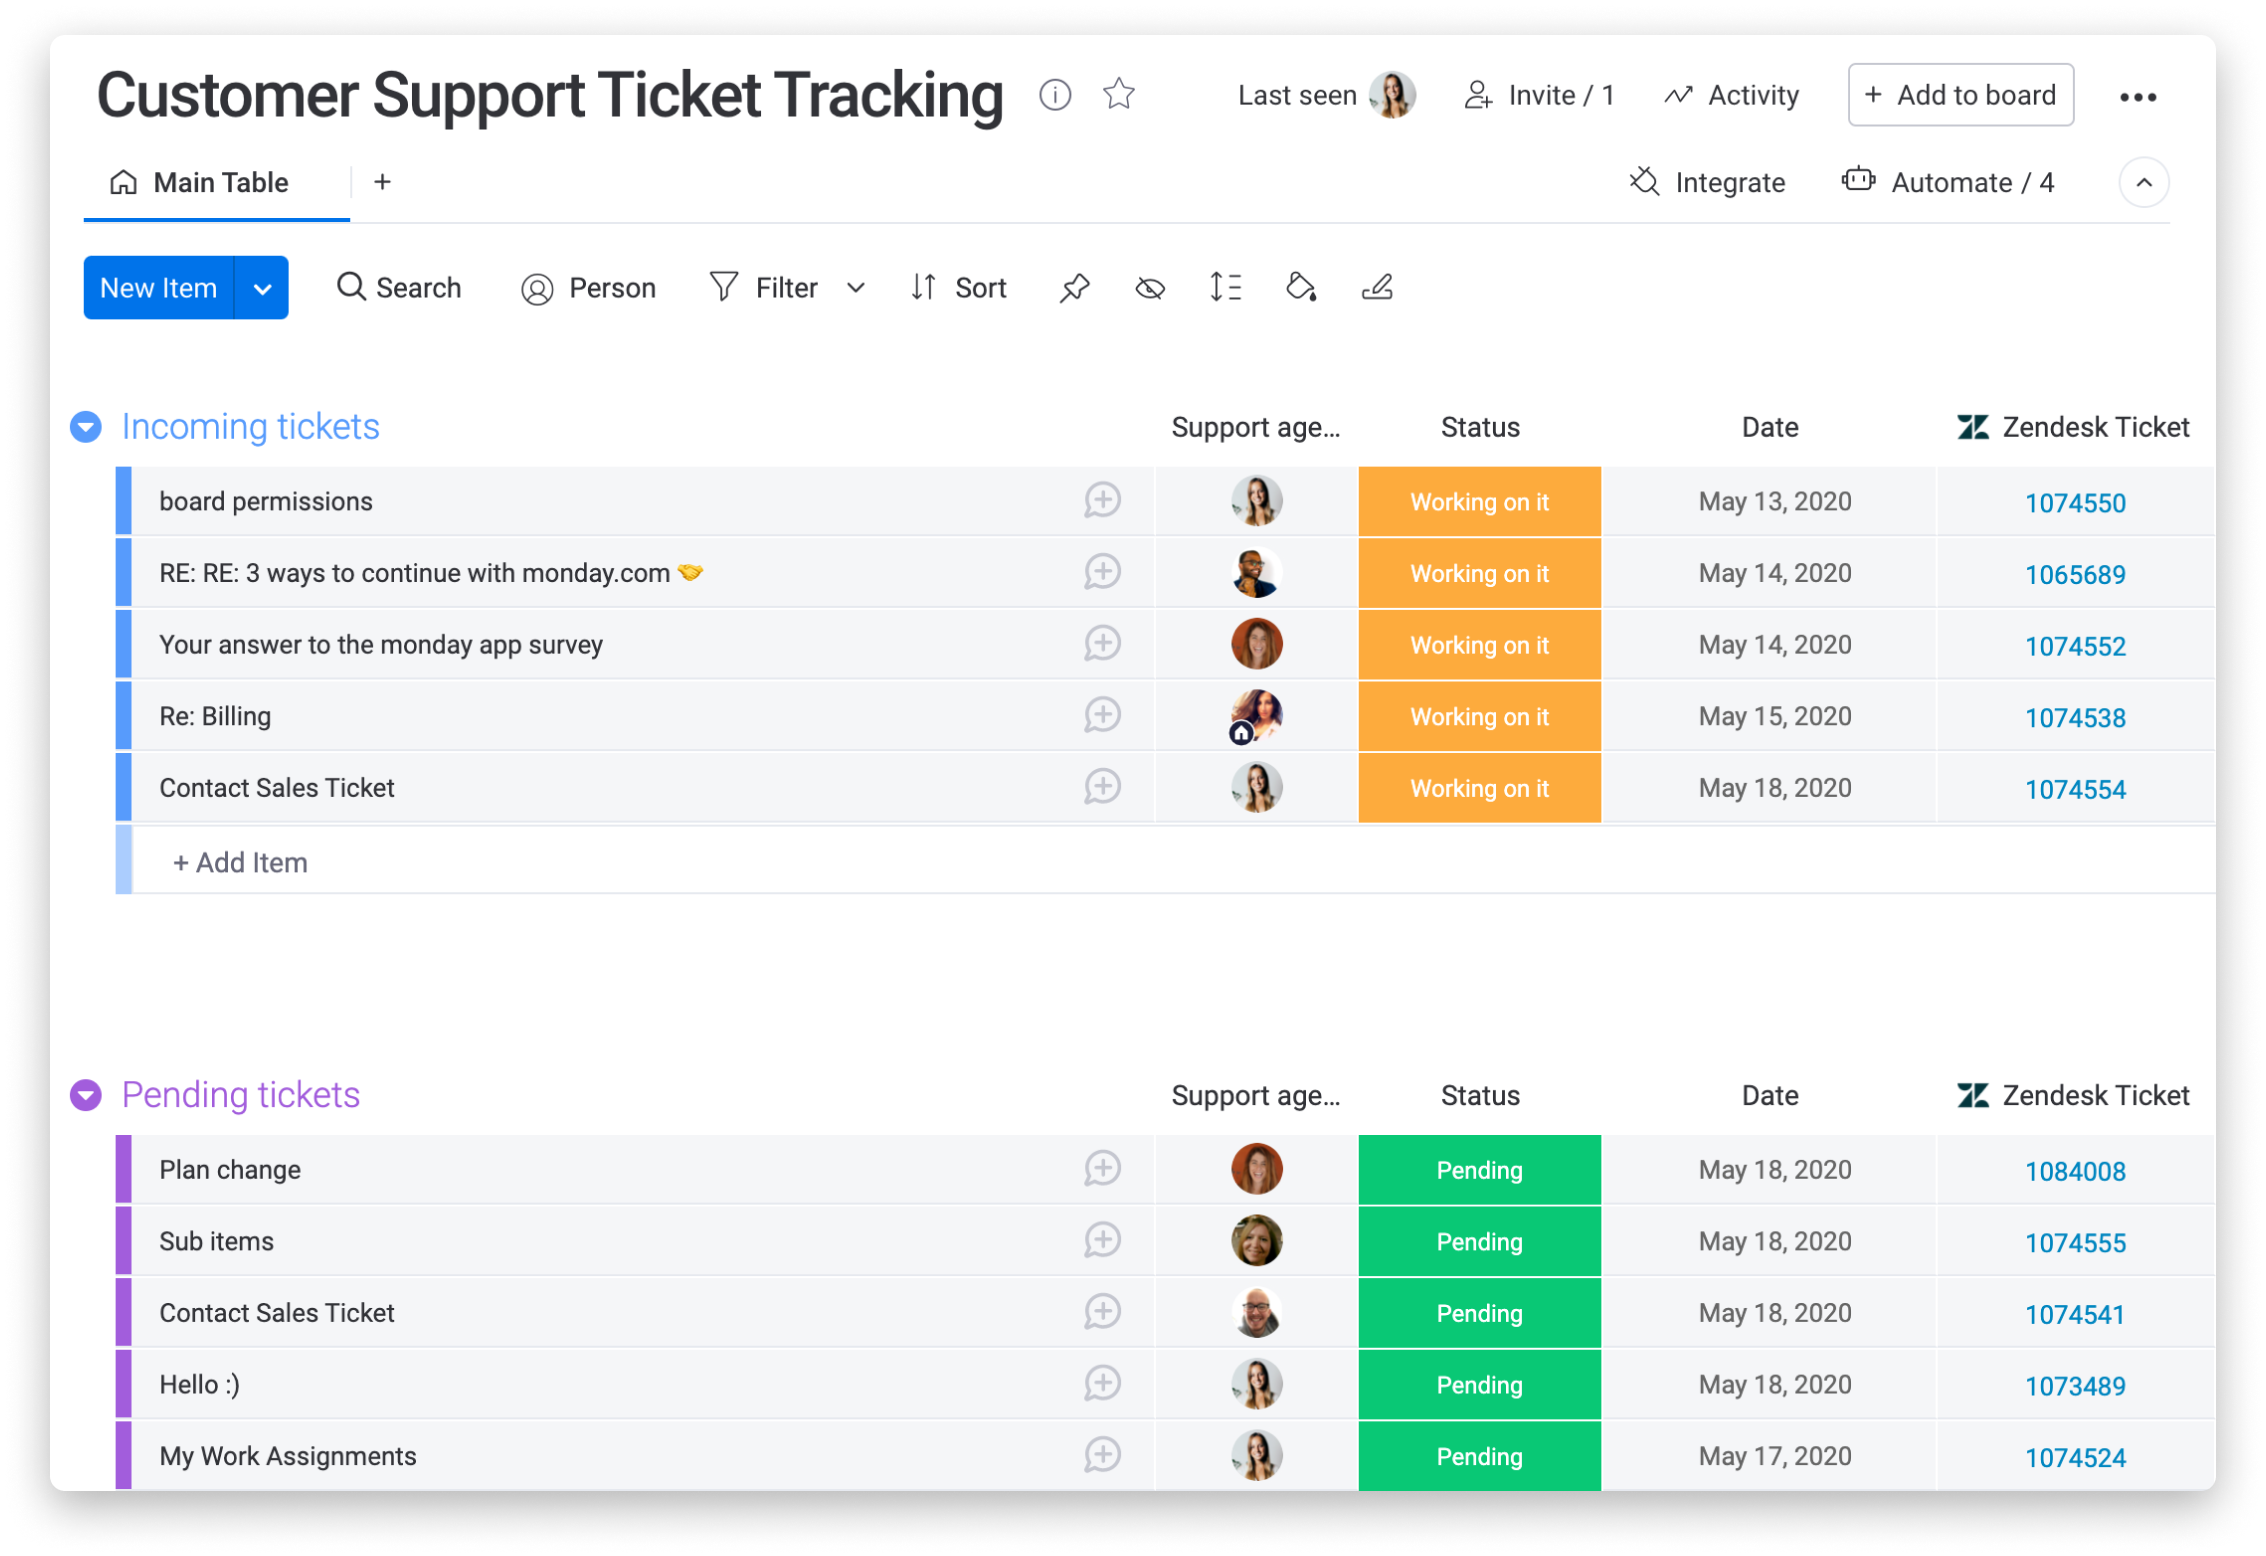
On this board, the top group represents incoming tickets that need to be answered and the bottom group represents pending tickets that have been responded to. The items represent each unique support ticket.
Now that you have the basis of your board setup, let’s take it up a notch with some more advanced features!
Integrate your bards with external platforms
monday.com allows you to integrate with a ticketing platform called Zendesk. Doing so can allow you to instantly pull relevant client inquiries, feedback and questions from Zendesk directly into monday.com. In turn, this information can be evaluated by the Customer Success Team to bring about positive improvements.
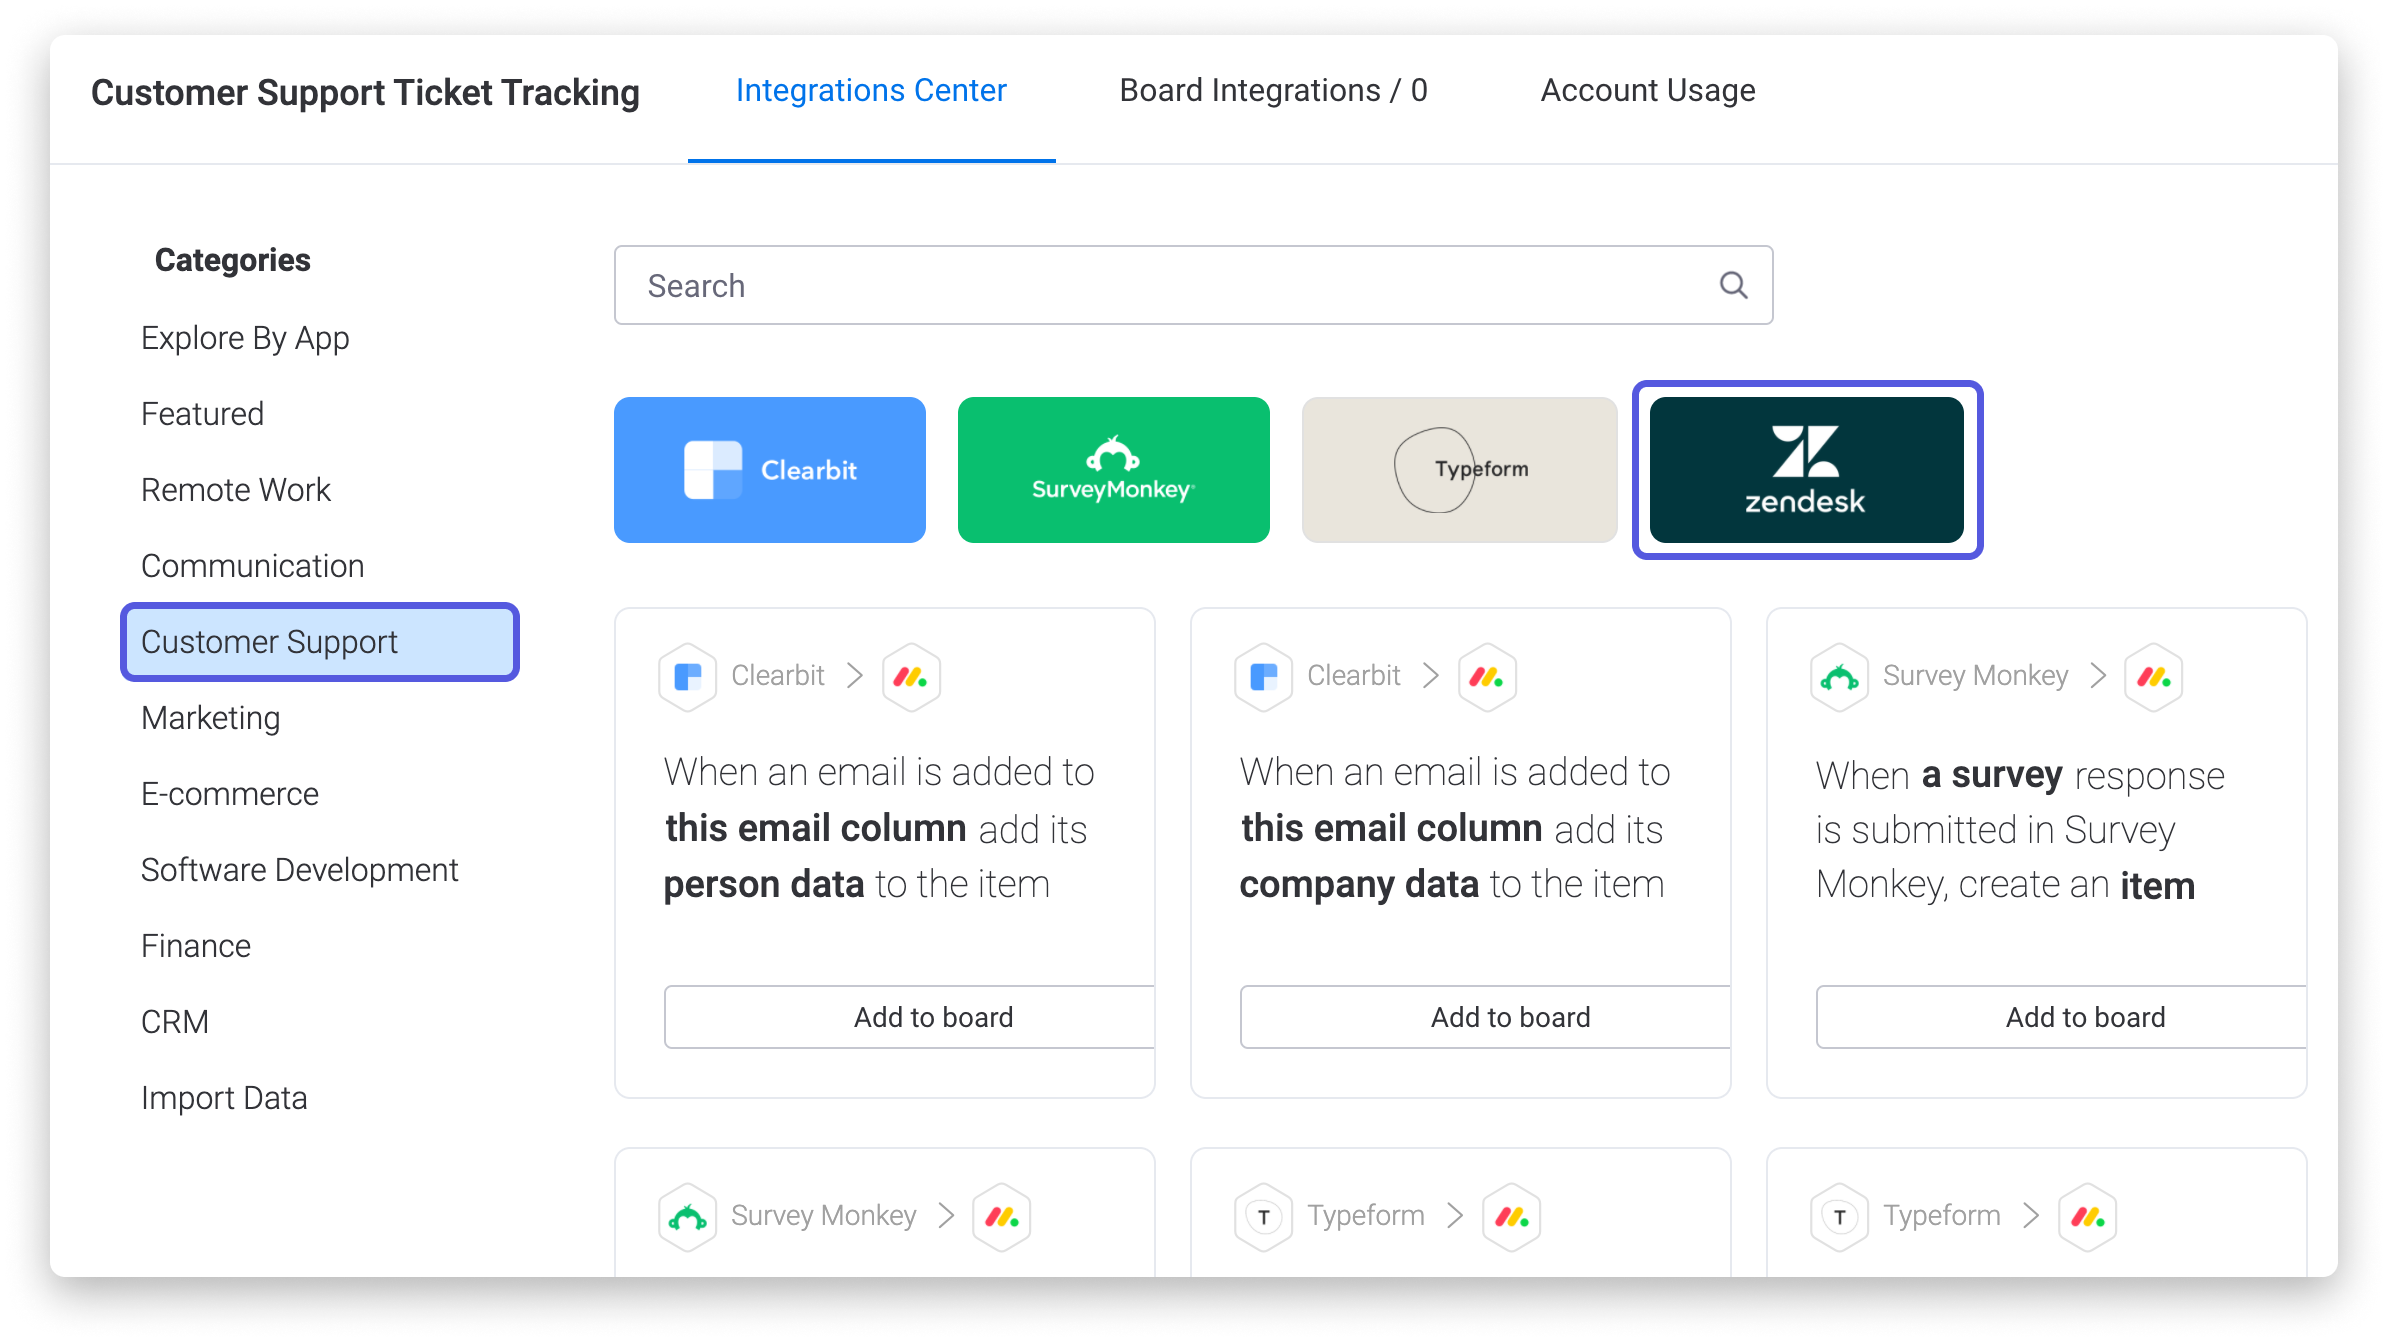
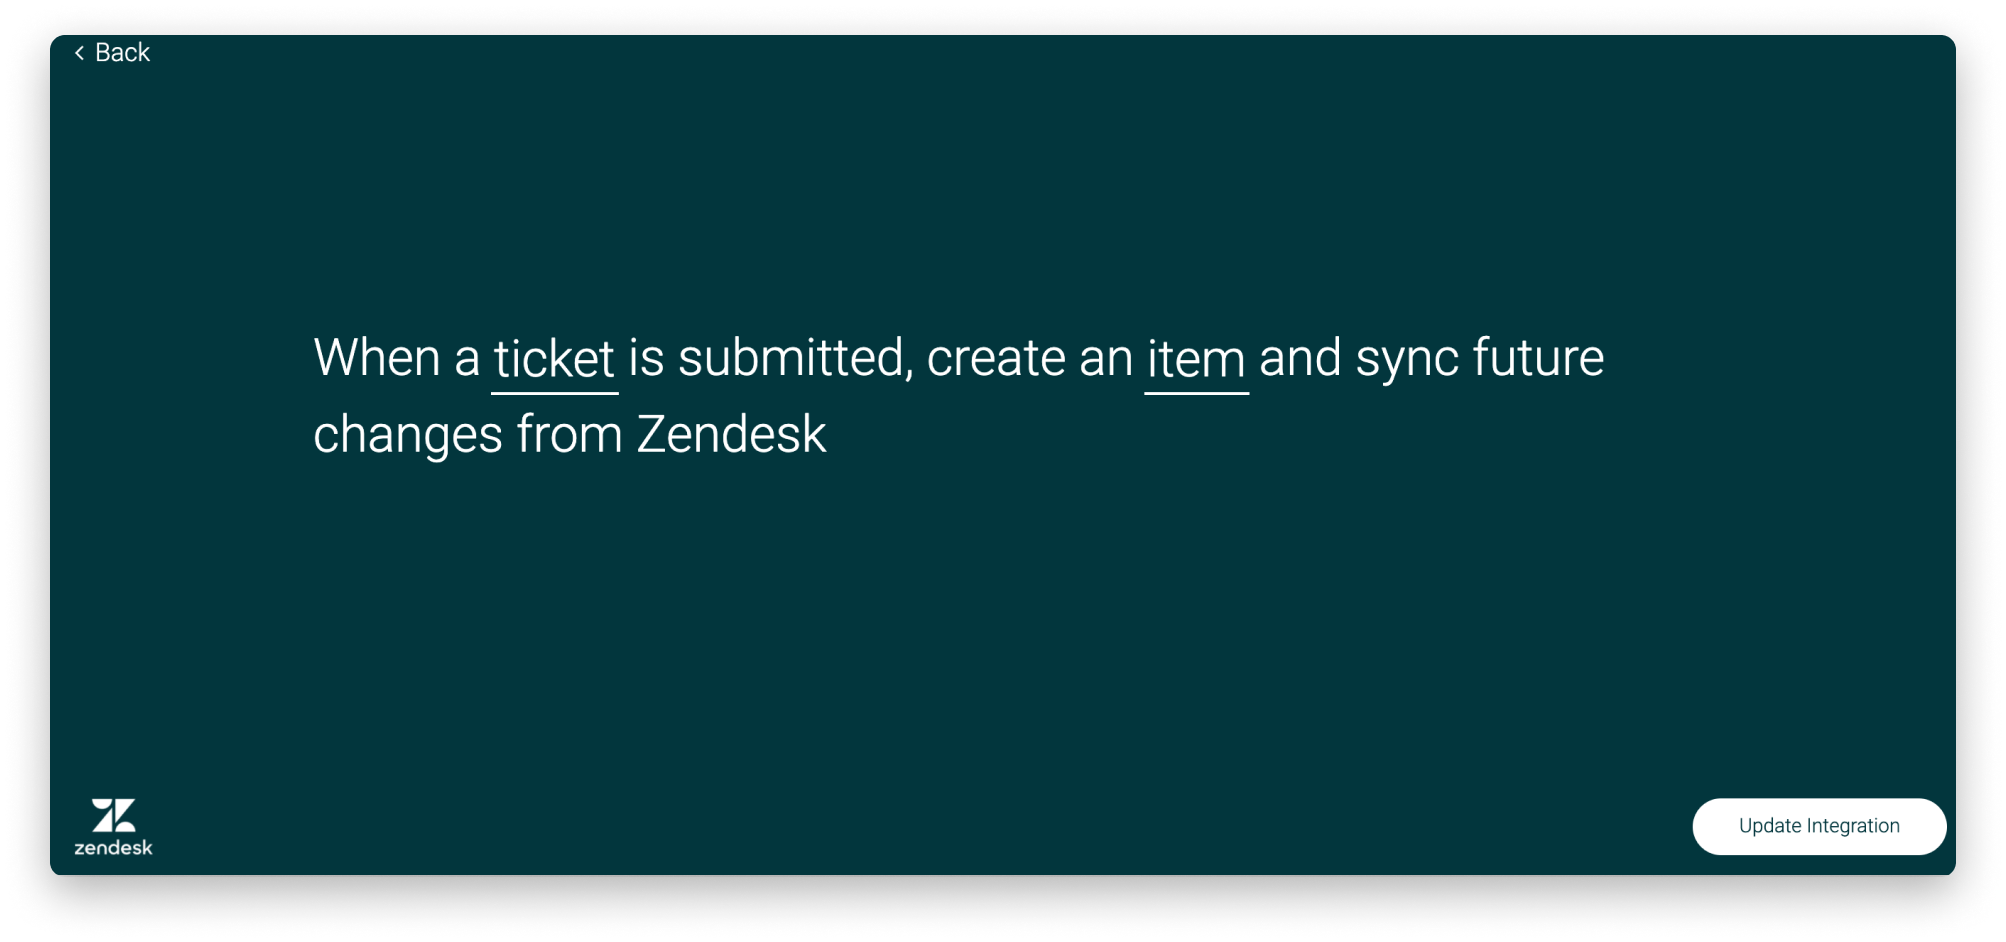
For our use case, we are interested in tracking all incoming tickets received from our customers in order to assign and answer them accordingly. We can use the following Zendesk integration recipe in order to pull in all incoming tickets into our board and to sync future changes that happen in that ticket:

When setting up the integration, we’ll need to customize which exact tickets should be pulled into the monday.com board. Since we want all new tickets will be transferred to our board in this scenario, we made sure that there is no filter set on the 'ticket' field of this recipe:
Configuring the 'item' field of this recipe will allow us to select which information from the Zendesk tickets will be mapped into each column on your board. In this case, we chose all new tickets to go to the 'incoming tickets' group, the description to be added as an item update, and the subject as the name of the item:
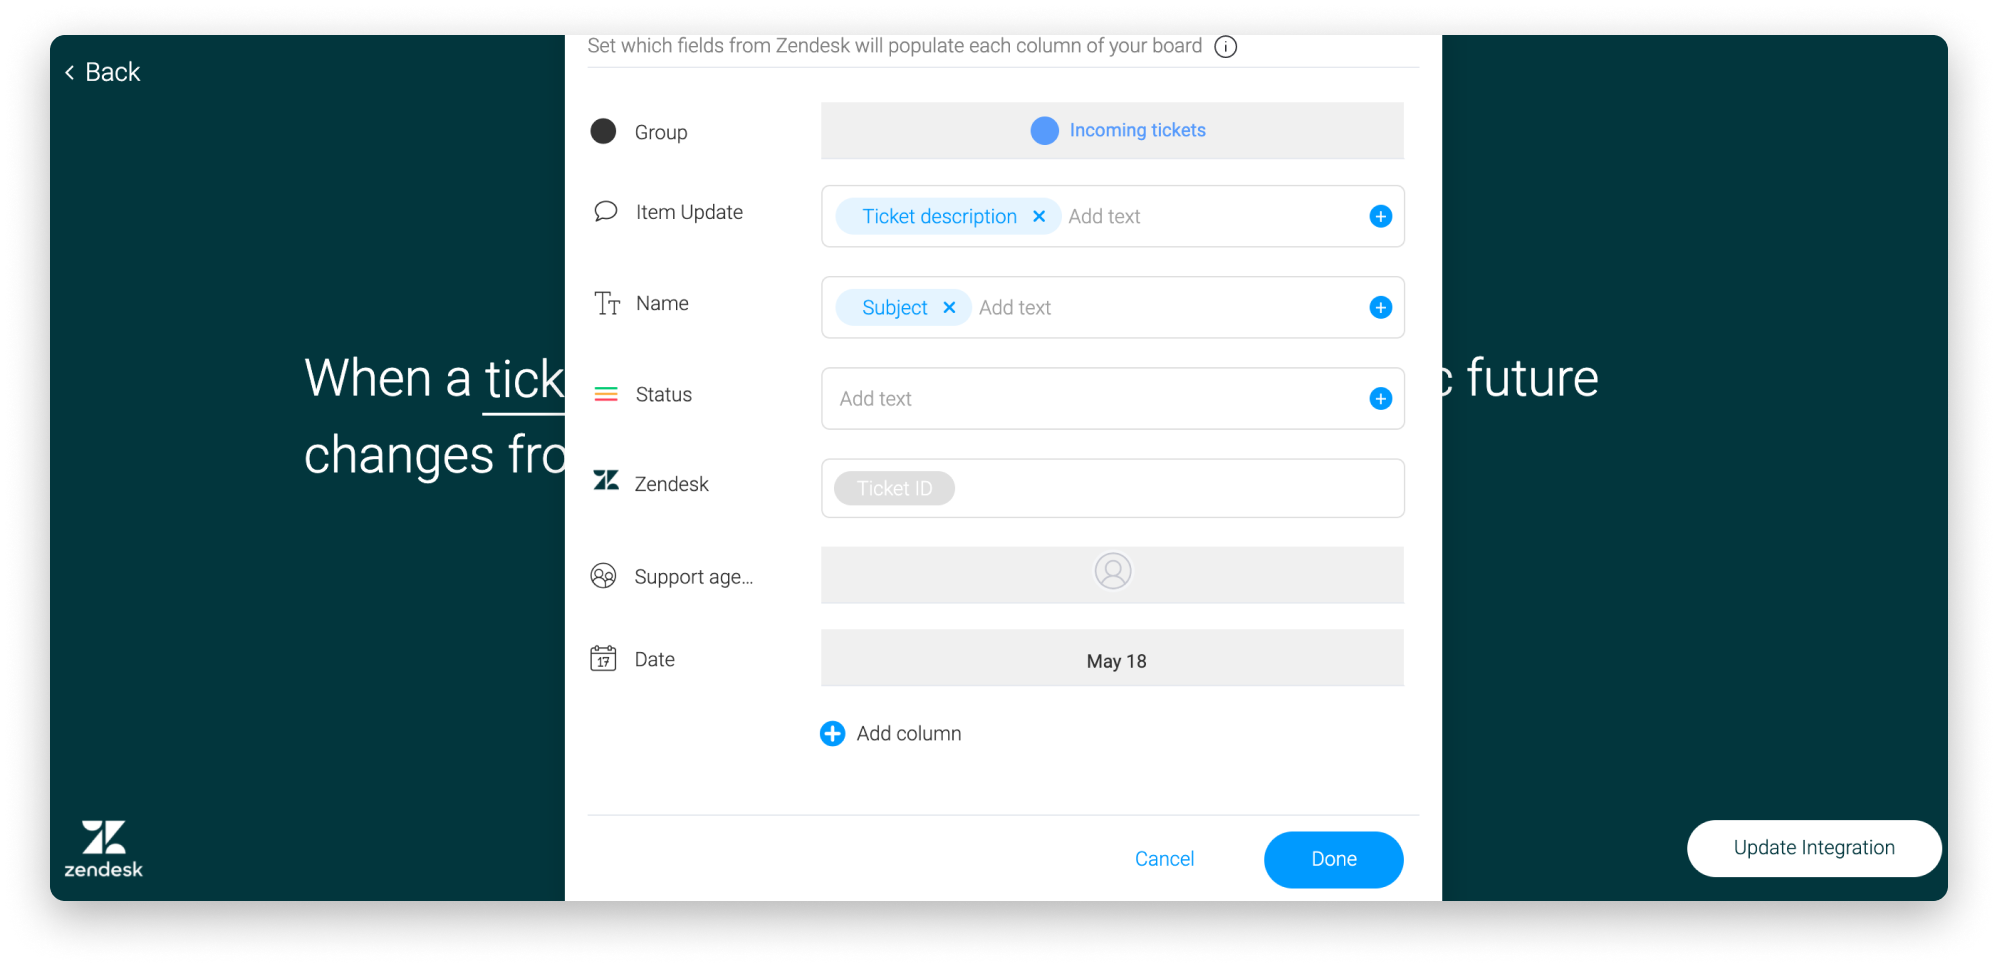
By mapping out your item to your own liking, you'll be able to automatically pull in all desired ticket information directly into your board, saving you time and manual work that you have to do! 🎉
Use automations to further enhance your workflow
Now that a Zendesk integration is utilized to help bring in tickets and sync their information onto our board, monday.com automations can help boost this workflow and reduce manual work that needs to be done!
On our ticket tracking board, we've added four different automations:
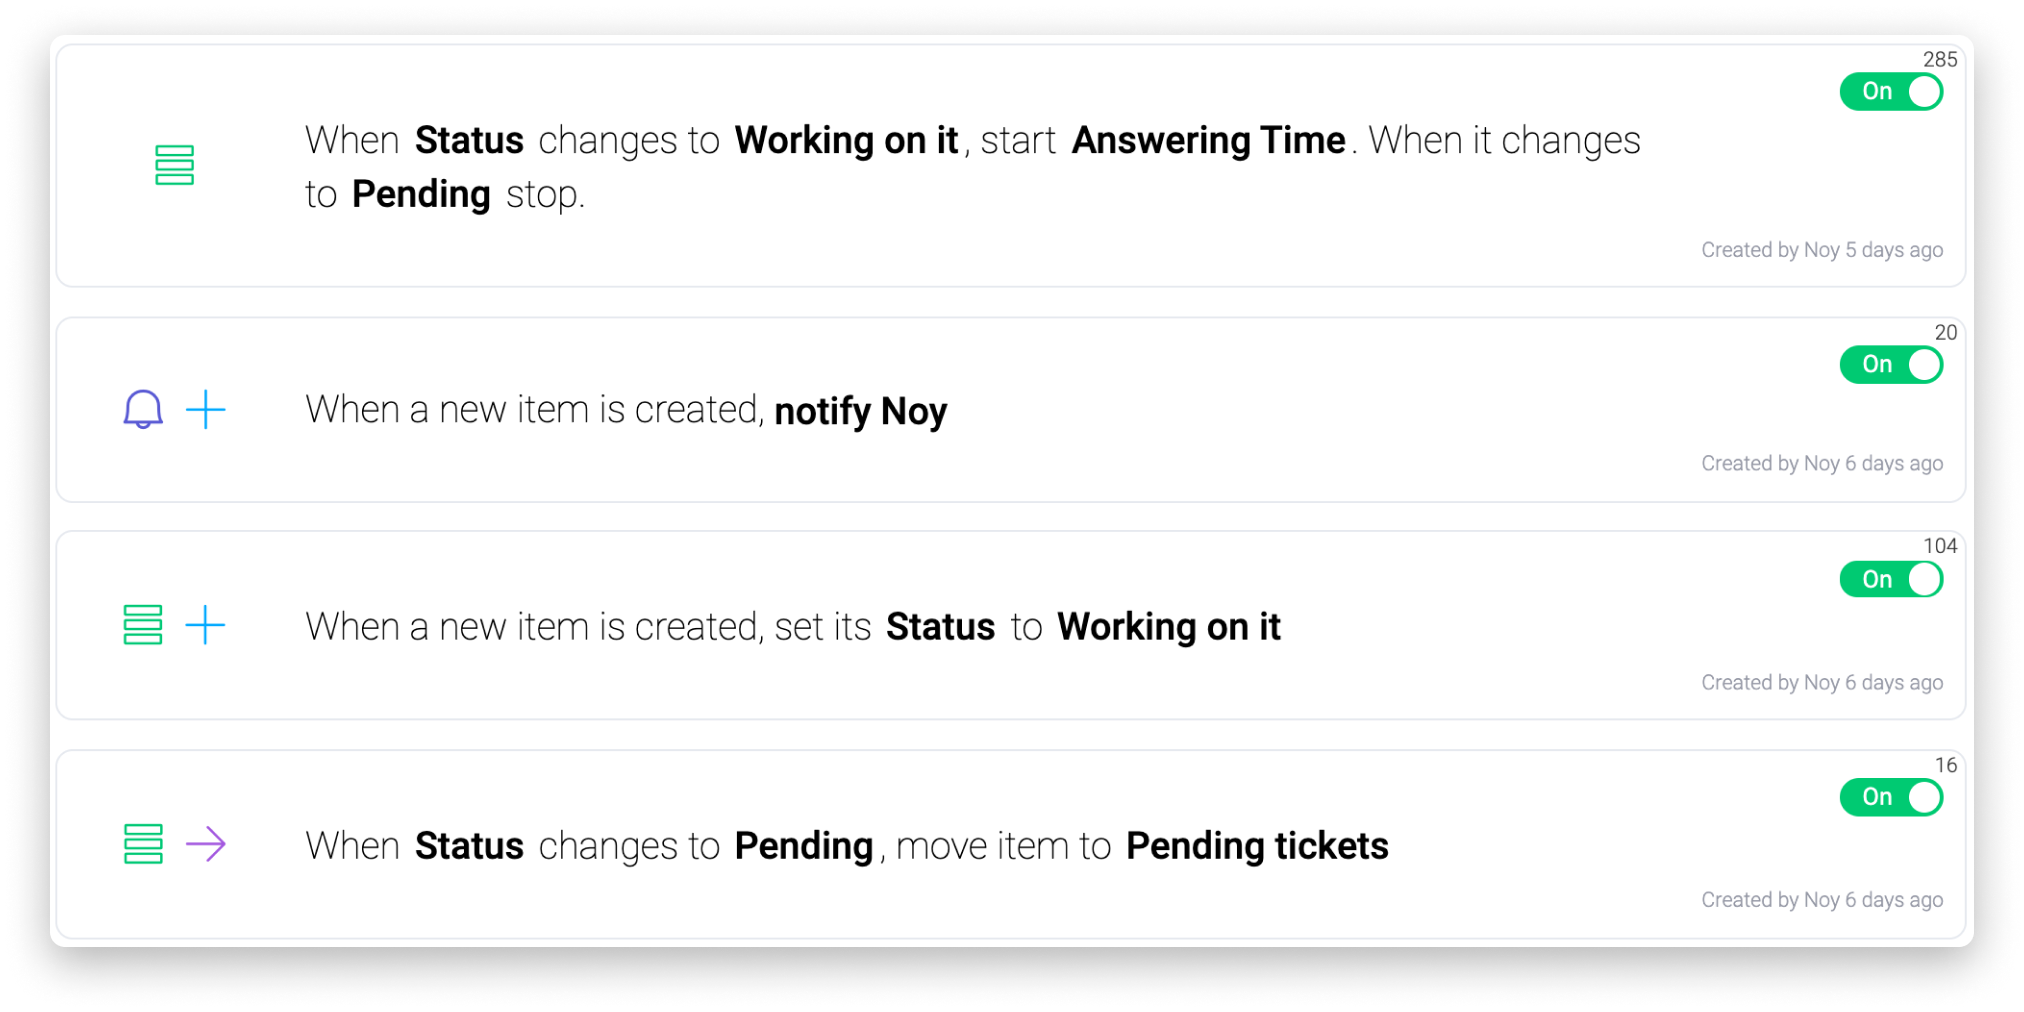
Using these automations, we can automate the process of turning on/off the Time Tracking Column , notfiying relevant people when new tickets are submitted, instantly move our items to the relevant group according to its status, and more!
Now that we've seen a ticket tracking use case, let's explore how monday.com can be used to identify trends and create reports based off of support tickets. 🙌
Review and analyze tickets trends!
The Ticket Trends board below is great for tracking specific ticket topics being received in order to optimize both the support provided, as well as provide product feedback:
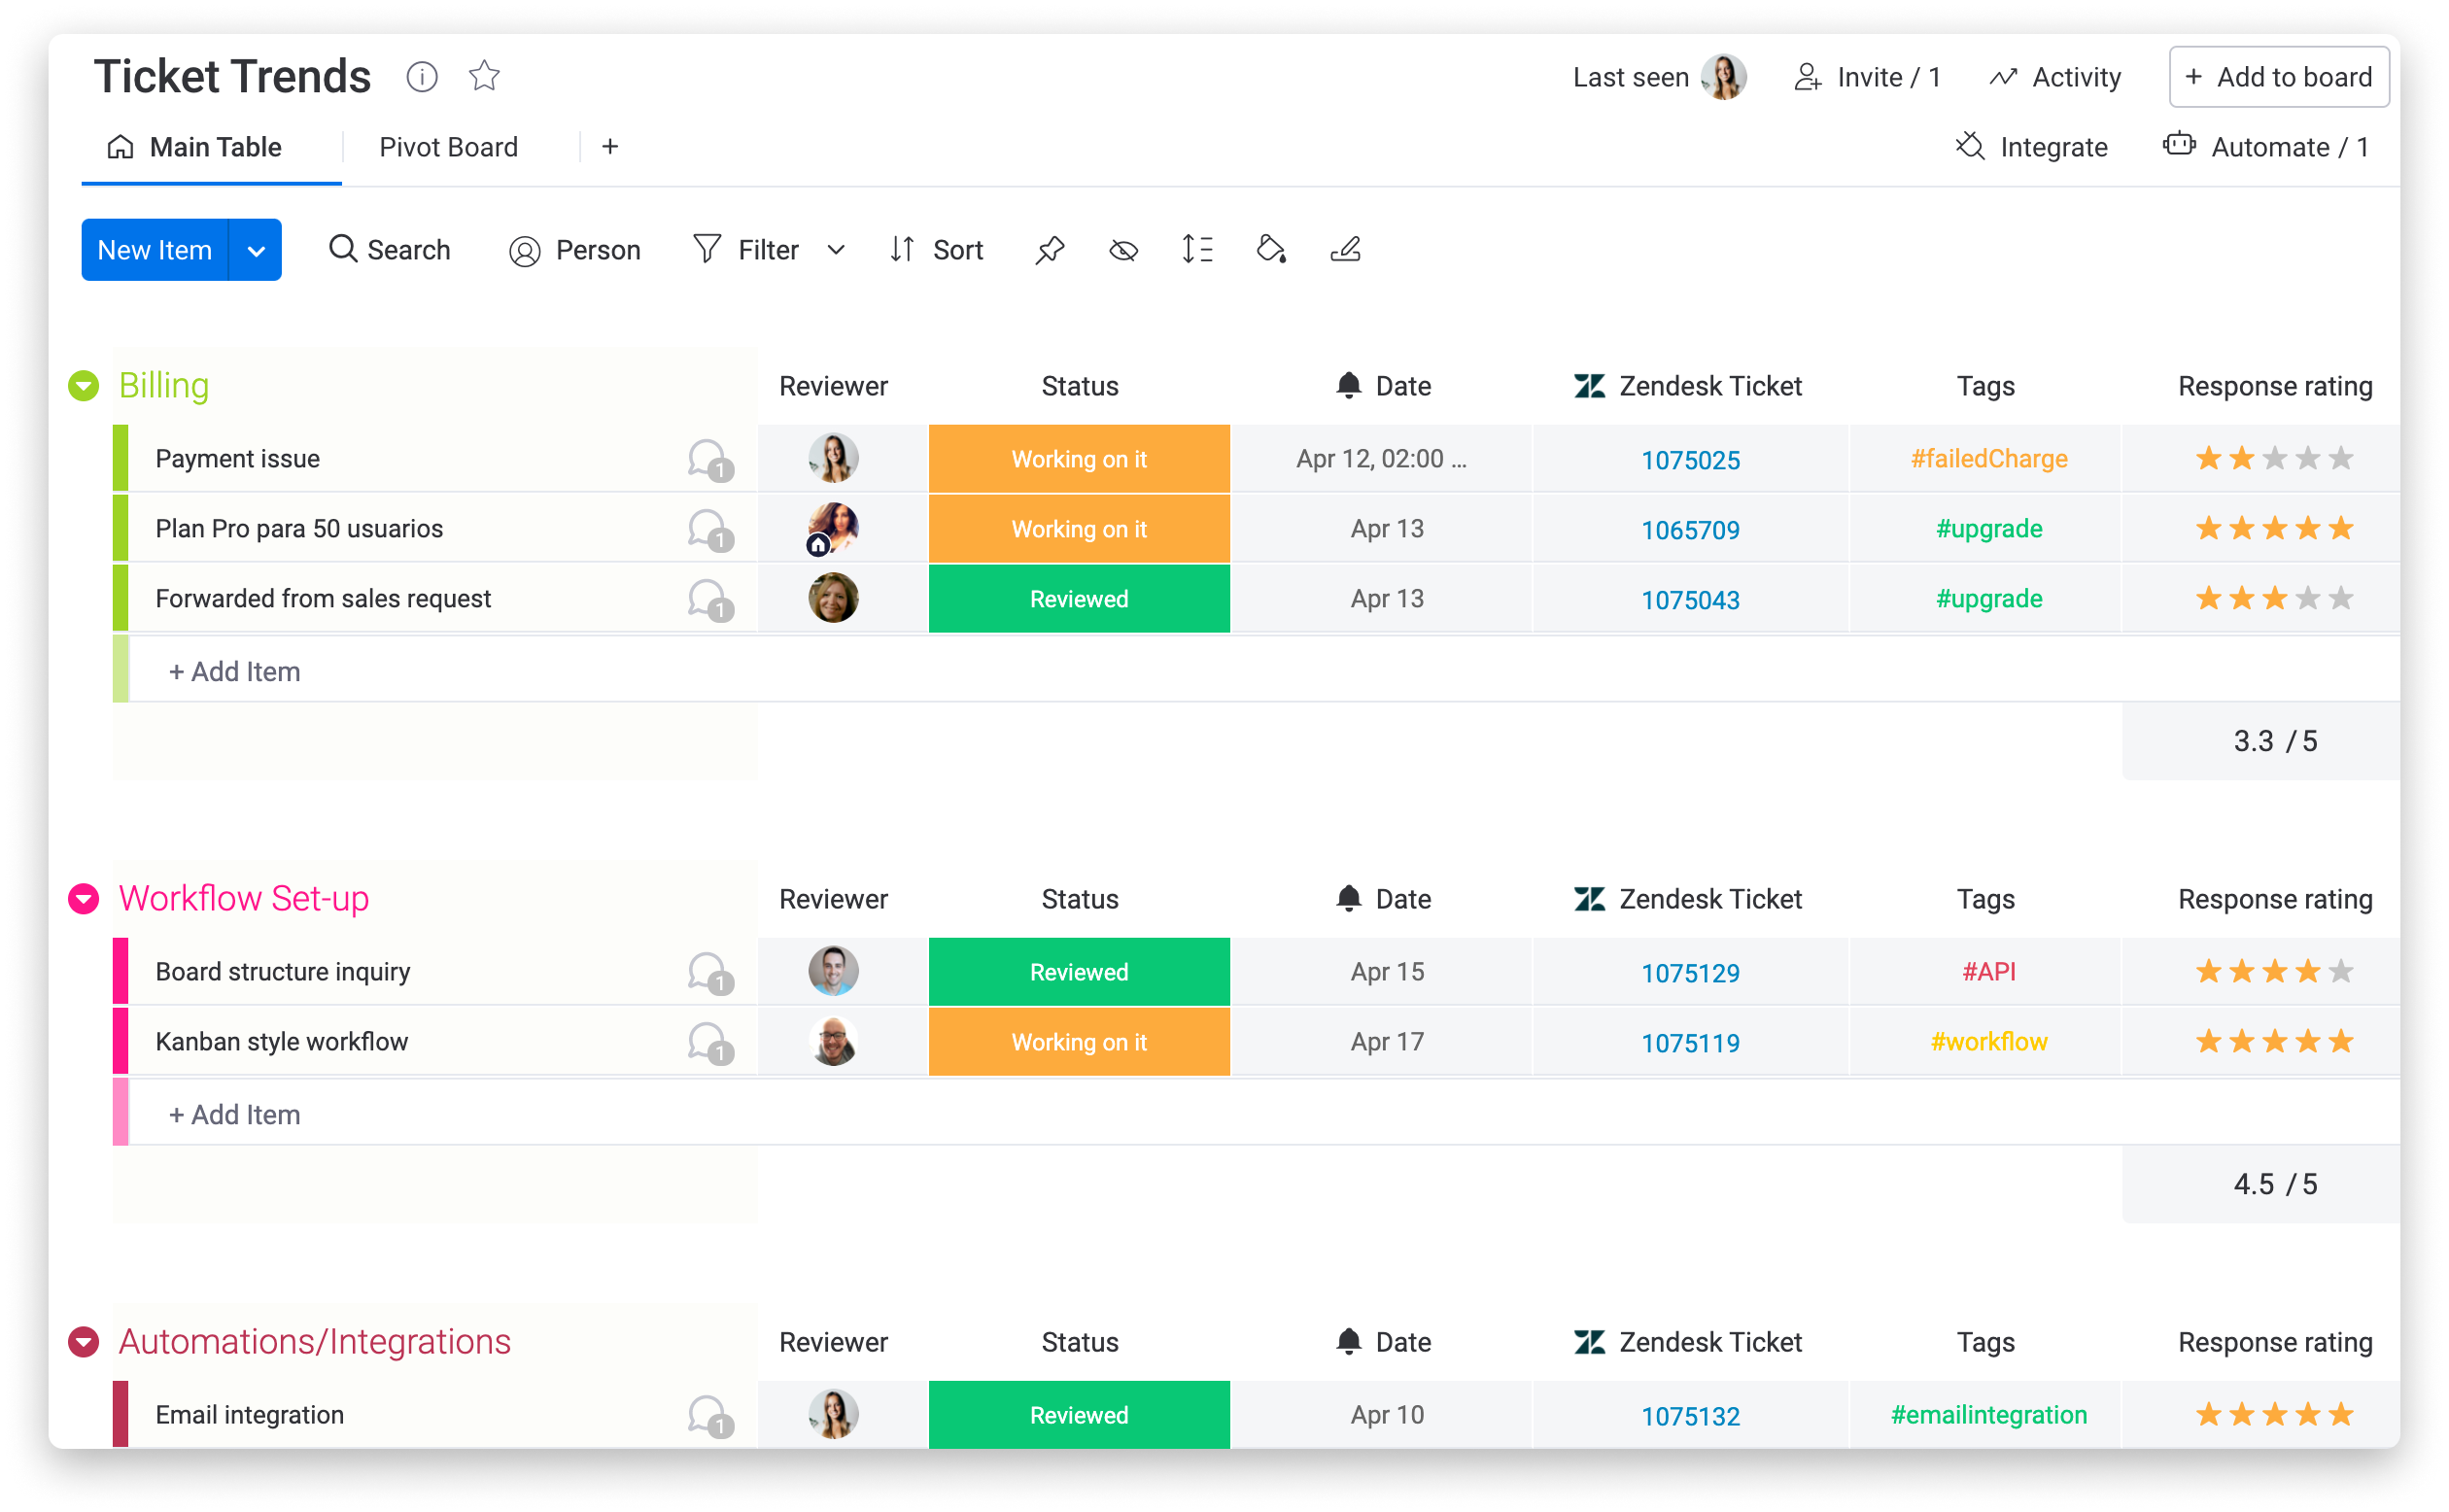
On this board, each group will represent a topic, or category, of tickets. Each item will be a ticket, such as an inquiry or question from a user that is related to the specific topic of the group that it is located in.
Now, let’s dive into the Zendesk integration again and see how to automatically pull in tickets based off of their topic into the correct group!
Integrating with Zendesk to track ticket trends
In this use case, we'll be using the Zendesk integration to pull in tickets into our board according to their topic in order to analyze ticket trends and create useful reports on this information! Data such as this is crucial in order to influence the shape of the product in an effective, positive way.
This time, in order for the tickets to populate into the correct group (topic), we need a separate recipe for each group/topic. By setting up a different recipe for each topic, you can choose to filter in the relevant tickets according to the group that they belong to!
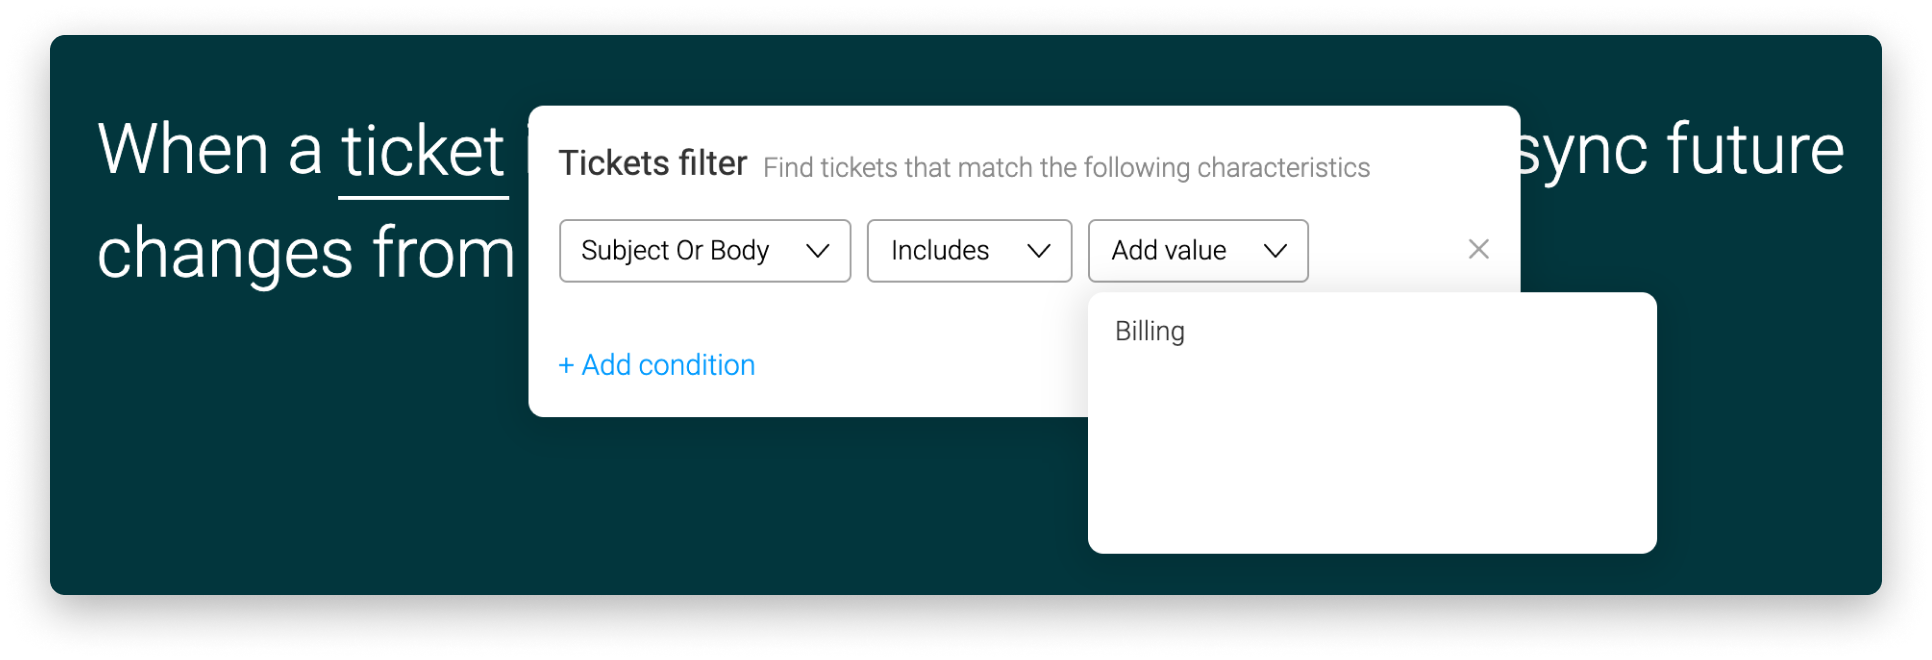
Once you've set up your filter, you can then map out the 'item' portion of the recipe to pull in the data from the tickets into the correct group on your board. As an example, it was important that all billing-related tickets went into the Billing group, so we configured the mapping as so:
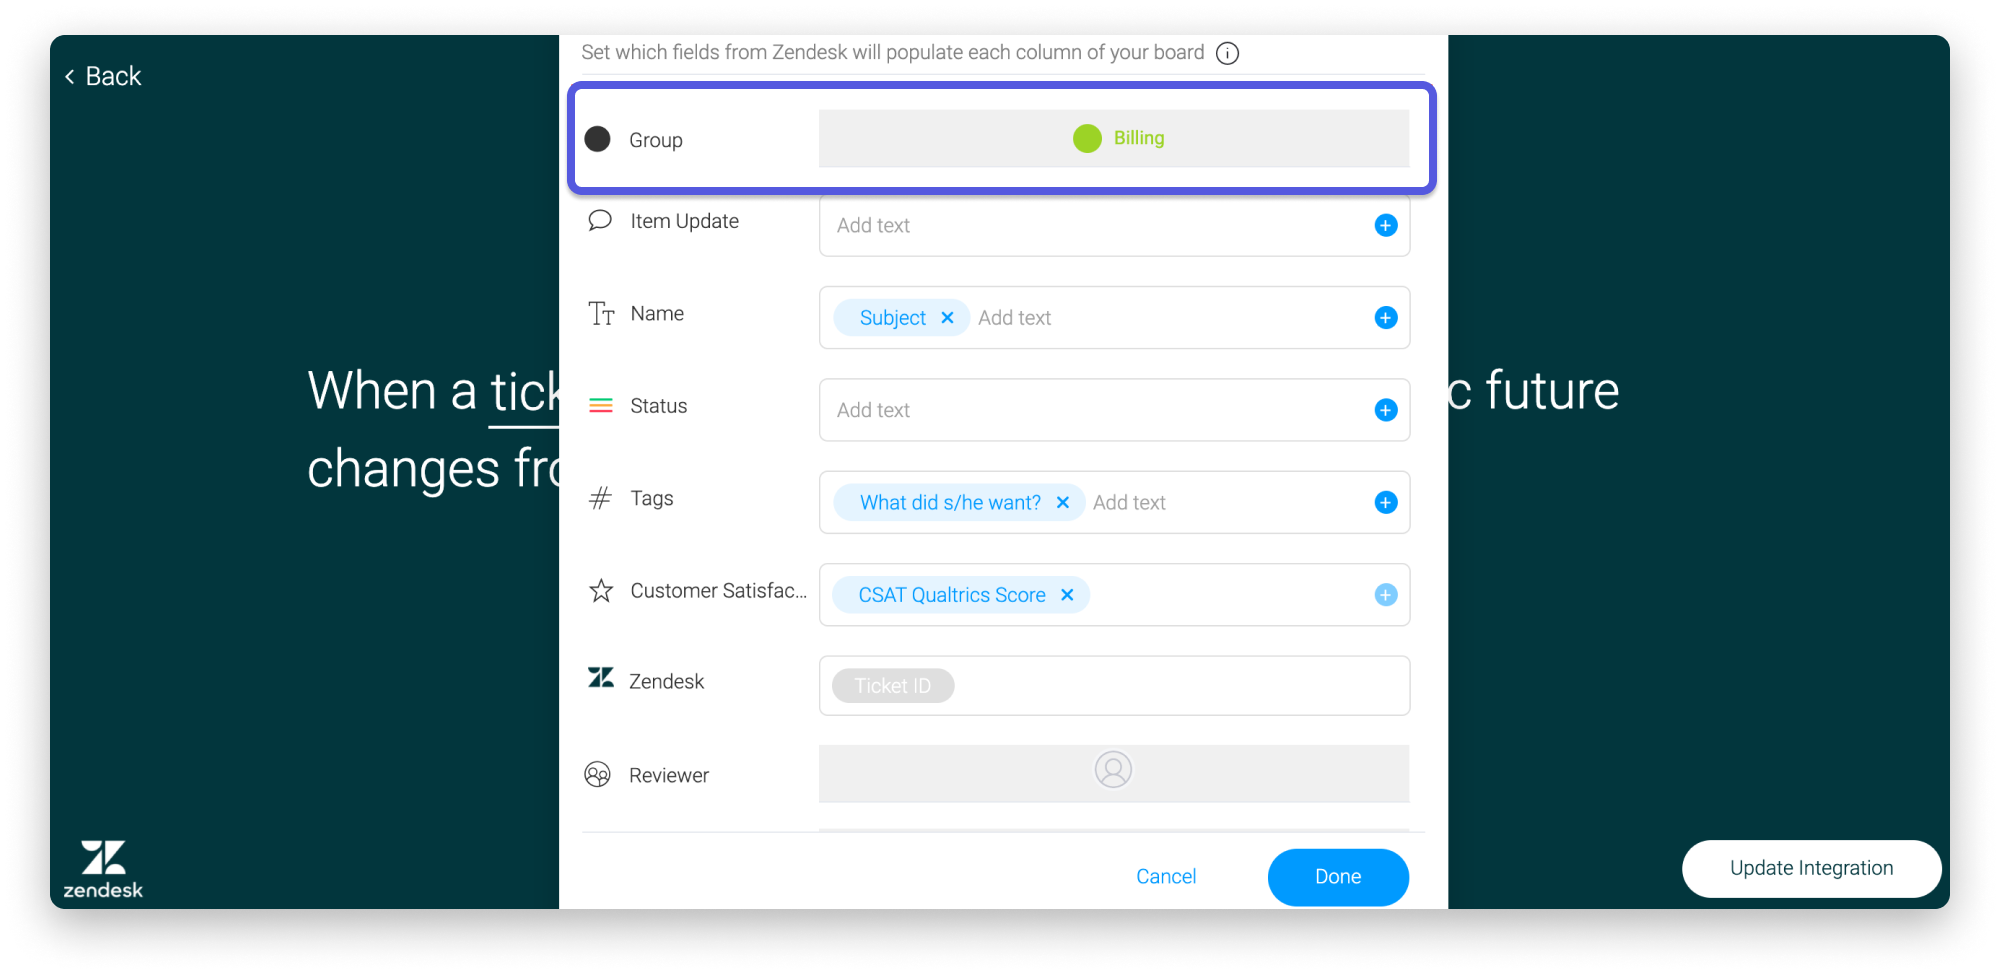
After completing this recipe for billing-related tickets, we went ahead and created the same recipe for the other ticket topics according to the groups that we've set up on our board. By doing this, each ticket will automatically populate into its respective group according to the topic!
Now, let's see how we can use this set-up to analyse different trends and create reports. 🎉
Analyze data with the chart view
The Chart View allows you to analyze different verticals of your board by creating graphical representations of your data, so that you can draw important insights and actions from it.
In our case, we can use the Chart View to analyze the satisfaction level of our customers in different areas of the platform by viewing the average customer satisfaction according to the different ticket topics (groups on our board).
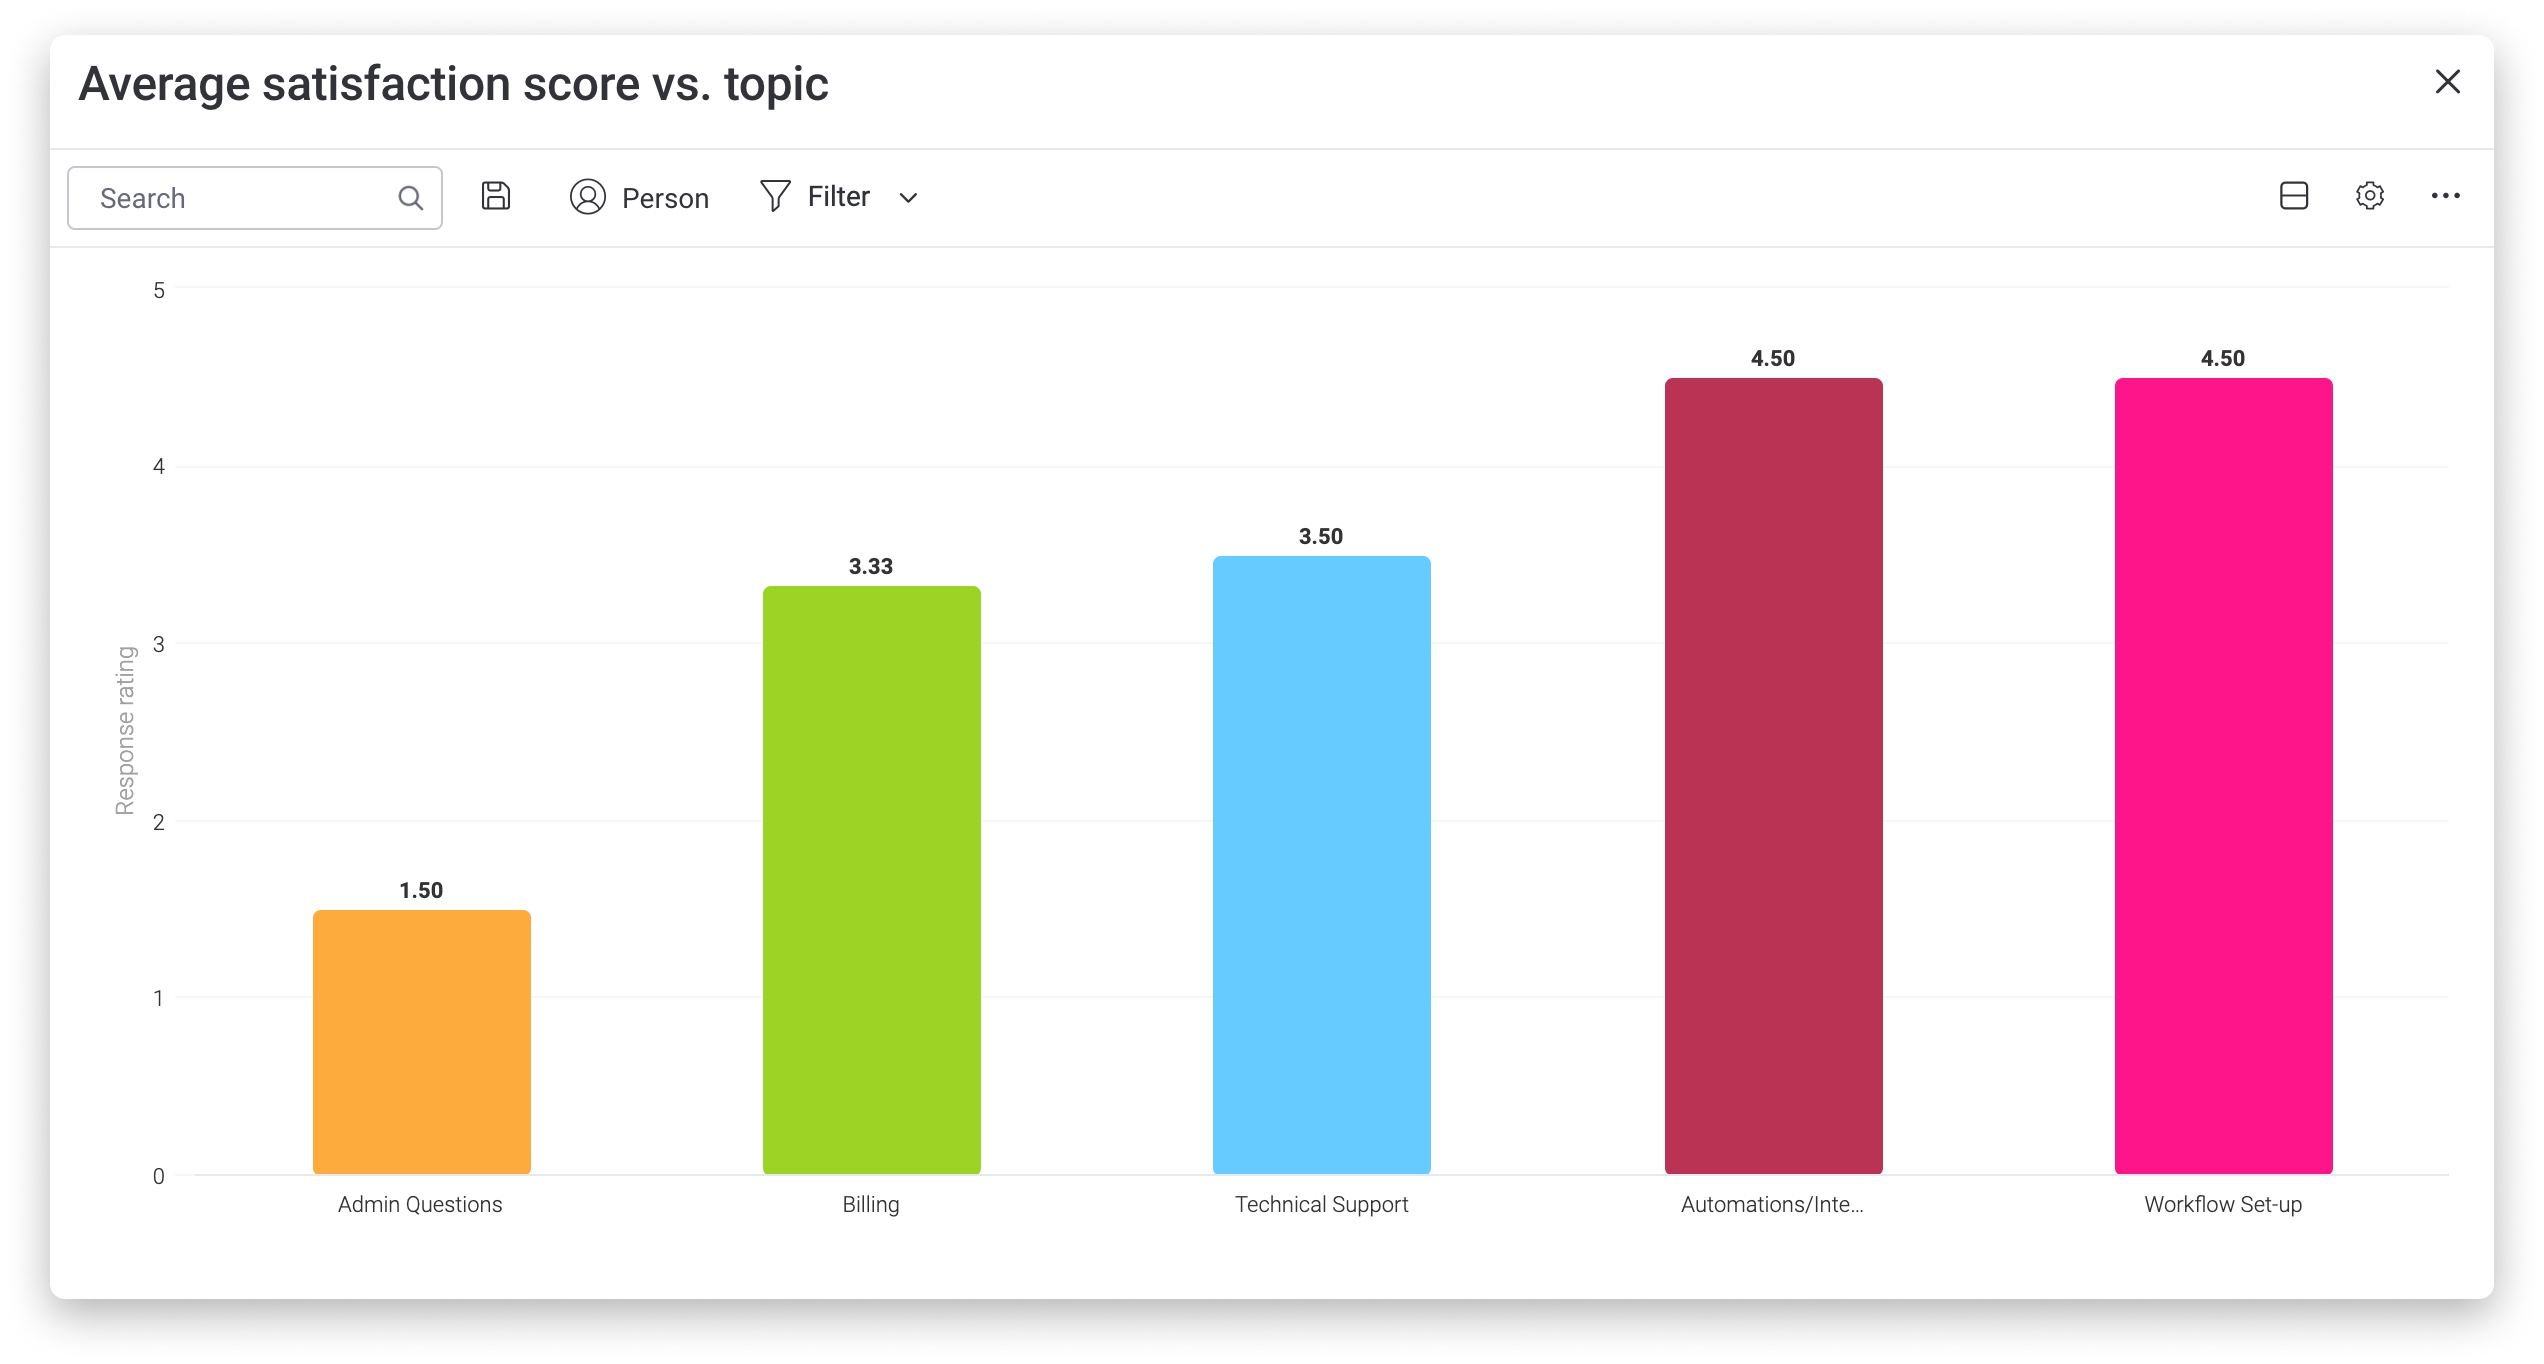
- How to set this up
The Chart View can be added onto your board by clicking on the plus sign at the top left of your board and then clicking on"Chart". From the chart settings, you can choose the bar chart type, select the groups to be presented on the X axis, and then choose the average of the response rating column for the Y axis as below:
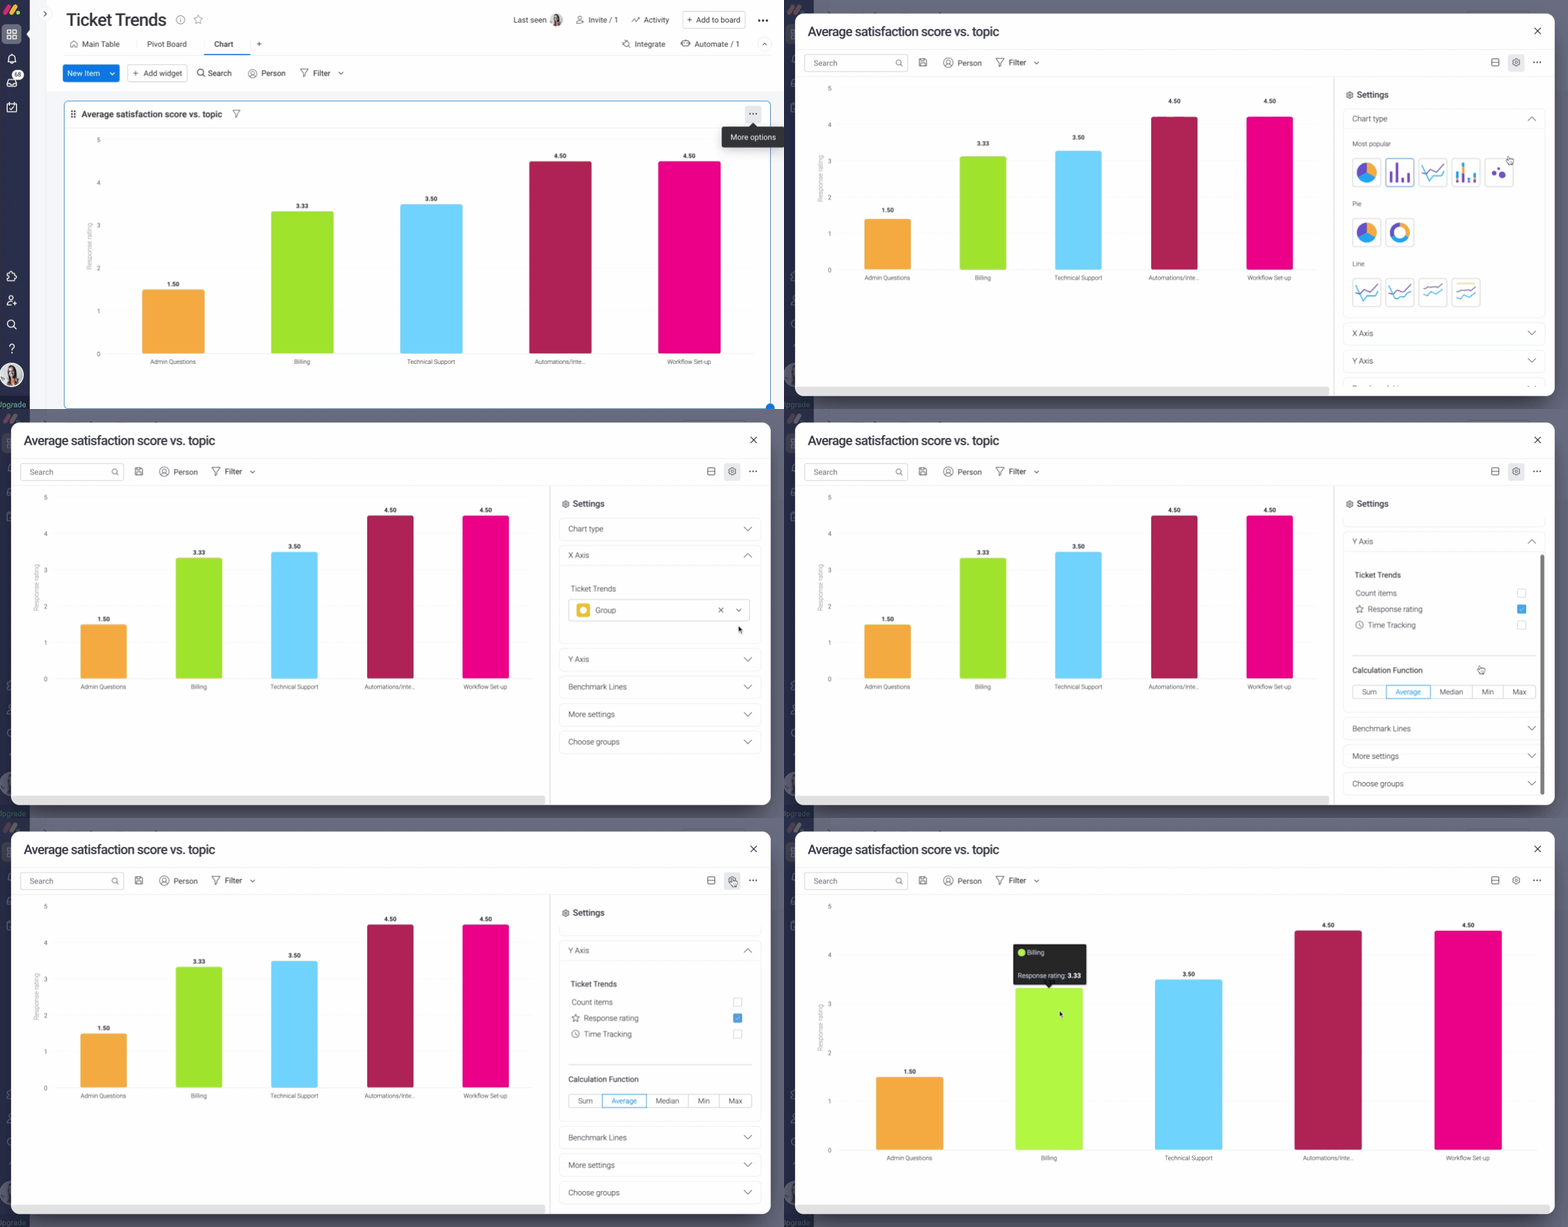
This setup allows us to easily see our average score for our service based on the different categories of tickets. By discovering information like this, you can help make data-backed decisions to improve your product and support according to the areas of the platform that need it the most! 💪
Create robust reports with the dashboards
To get an overview of what’s happening across multiple boards, you can use the Dashboards! This is great for reporting purposes, for managers to see how their team is performing, for goal setting and measuring success from multiple boards in one place.
In our case, we chose to create a dashboard to help analyse ticket trends and report on different aspects of our ticket revision process:
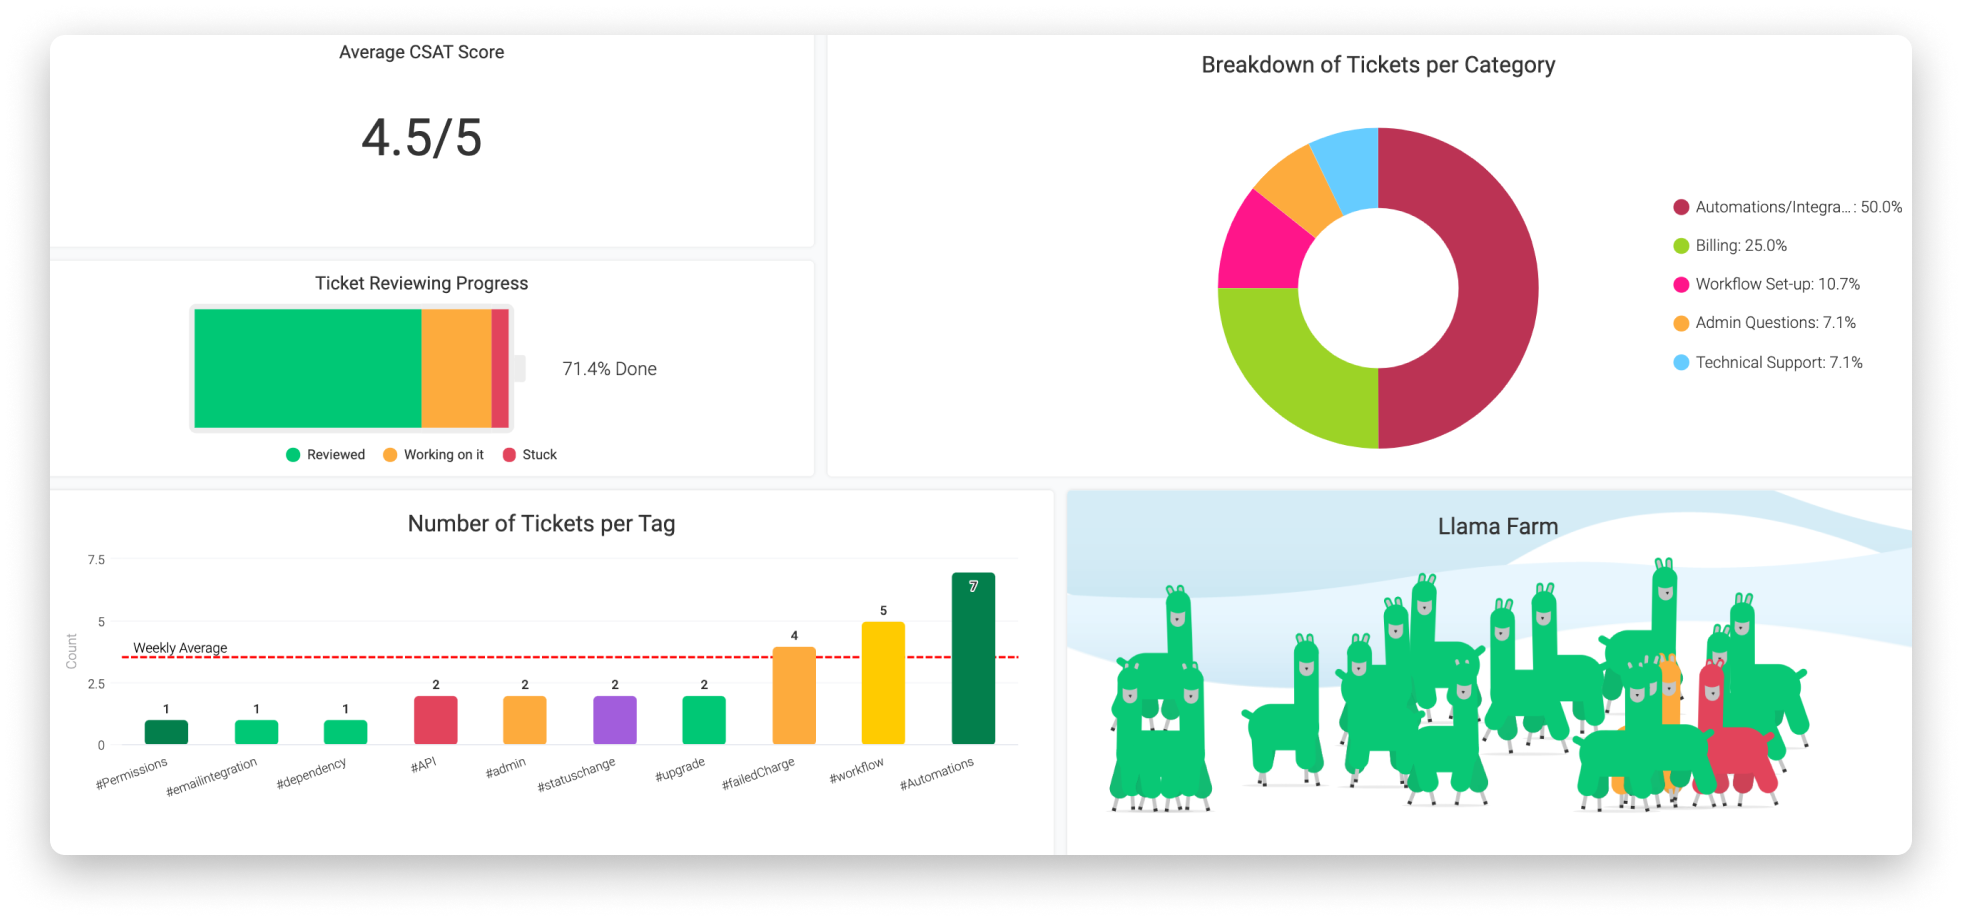
This dashboard allows us to see a breakdown of the number of tickets per topics and tags, and it also gives us insight into our average customer satisfaction score! Analyzing data like this is critical in helping improve our means of customer service and the impact that we have on changes in the platform. 🎉
There you go! Get started today to use monday.com as a Customer Support ticket system and to help report and analyze on this data!
If you have any questions, please reach out to our team right here. We’re available 24/7 and happy to help.
Comments