


Do you have loads of location-related data on your boards but need to visualize all this information easily? With Board to Globe, you can easily add this data to your 3D interactive globe and view it in a snap. See where your data points lie and connect with this incredible globe view. This is extremely helpful to visualize your international offices, remote employees, ongoing marketing campaigns, operations taking place around the world, your active users and so forth!
How to add it to your board and dashboard?
- Board View
To add the Board to Globe View to your board, click on the arrow next to the button "Main table" located on the top left of your board. Click on "More views" which will take you to the views center.
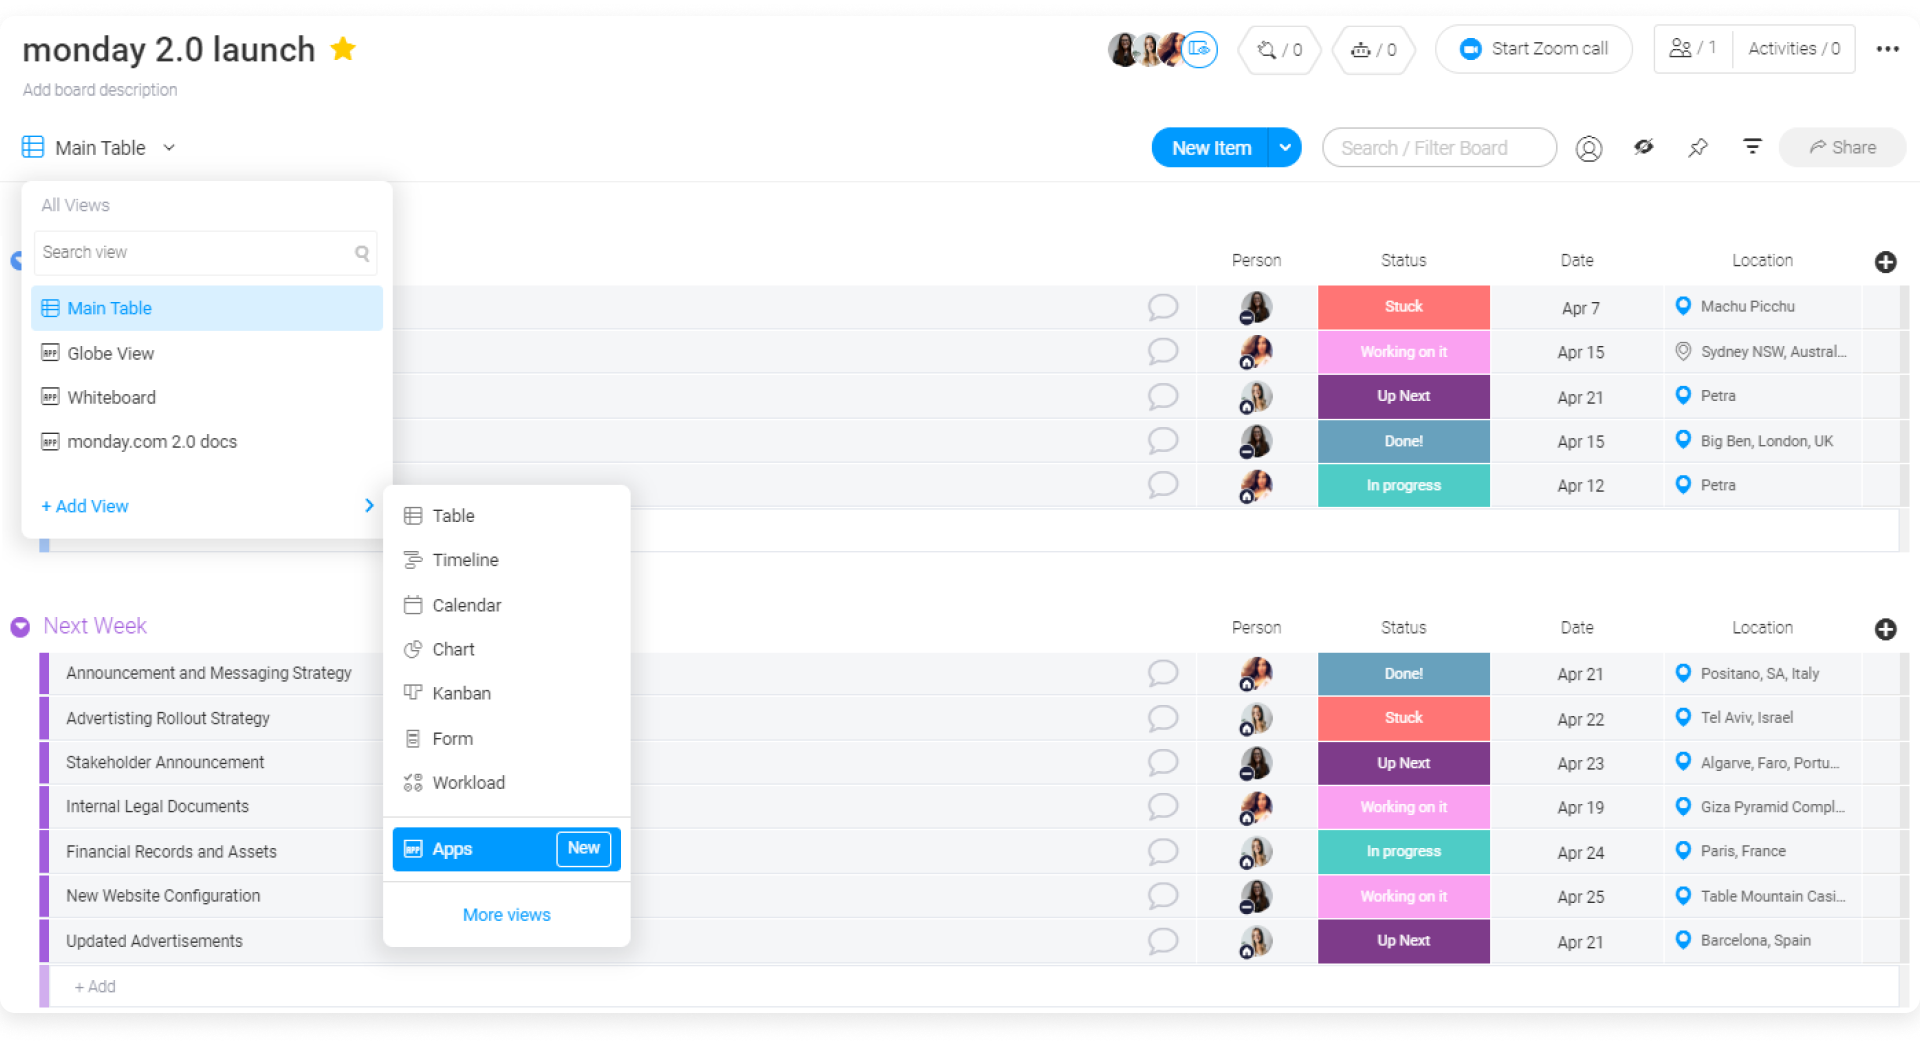
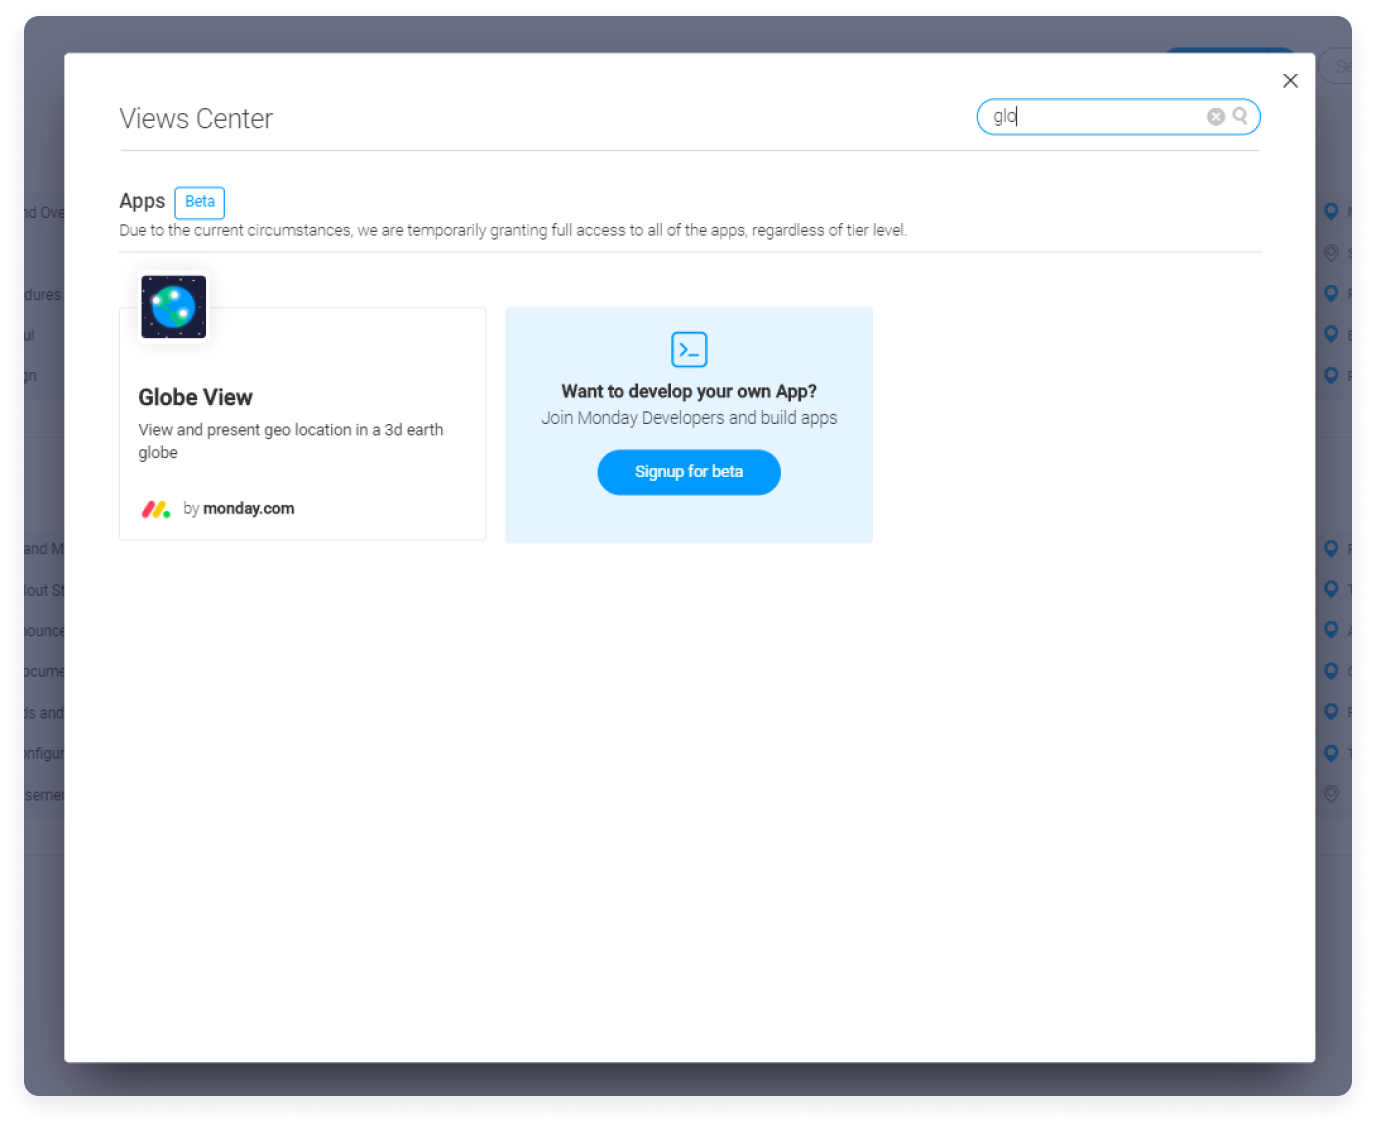
In the views center, search for "Globe" and add it to your board.
- Dashboard widget
To add the Board to Globe widget to your dashboard, click on the "Add widget" button on the top right of your dashboard. Click on "More" which will take you to the widgets center.
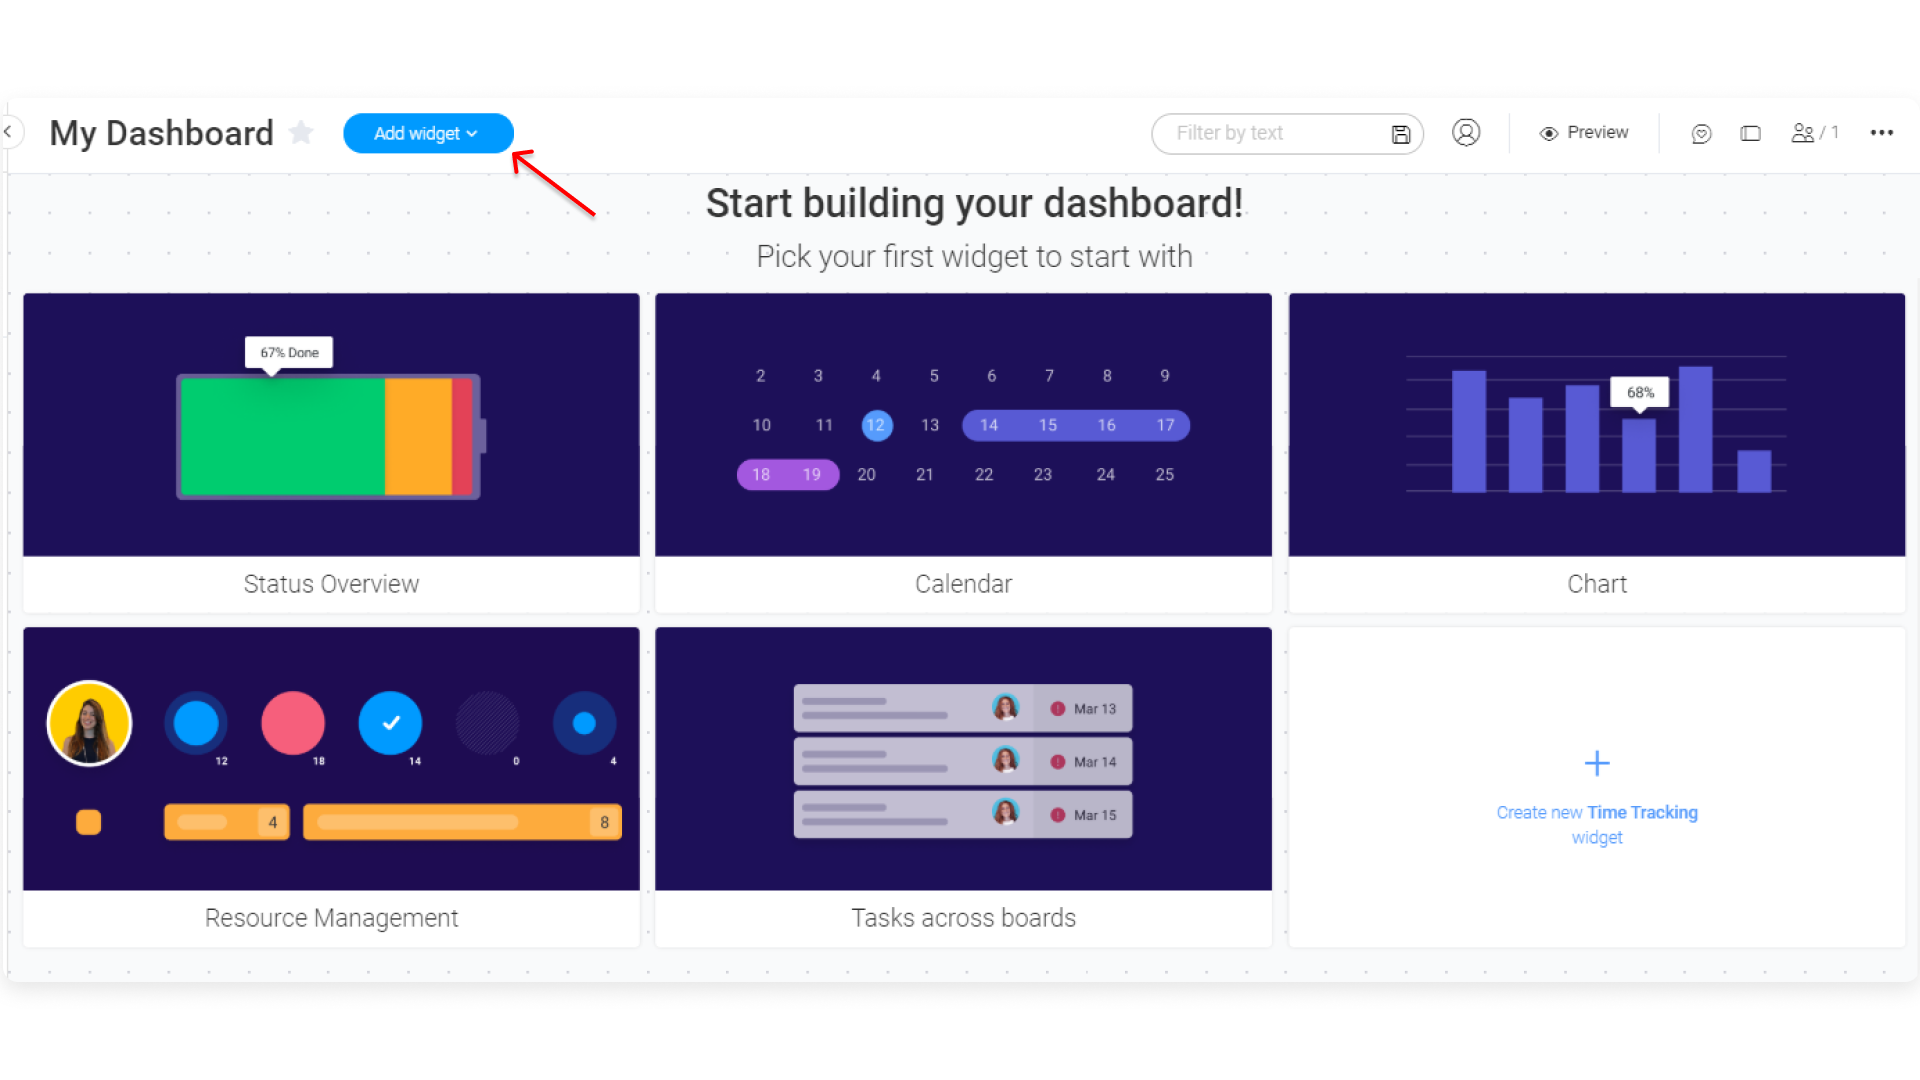
In the widgets center, search for "Globe" and add it to your dashboard.
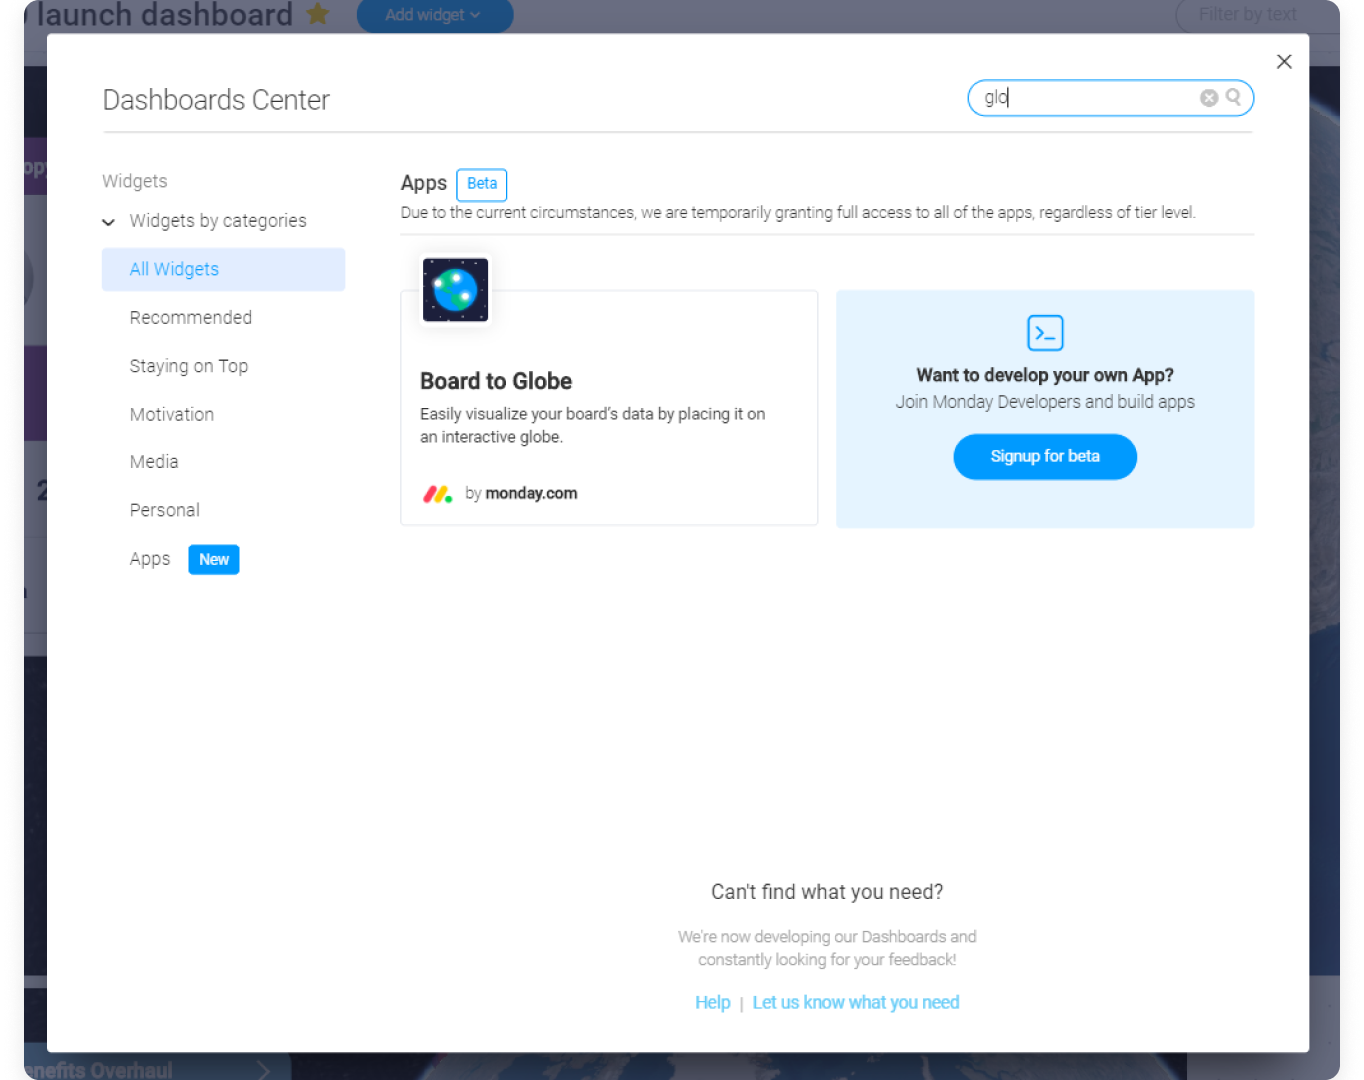
Once done, you will see a beautiful globe pop up on your screen, which you can start customizing.
How to customize your Globe?
You will have a few options to customize exactly how and what location information you'd like to see on your 3D globe.
- Step 1: Select your location column
Select which exact location column you'd like to be reflected on your globe. For the widget, you will need to select the location column from each board you've connected to the widget.
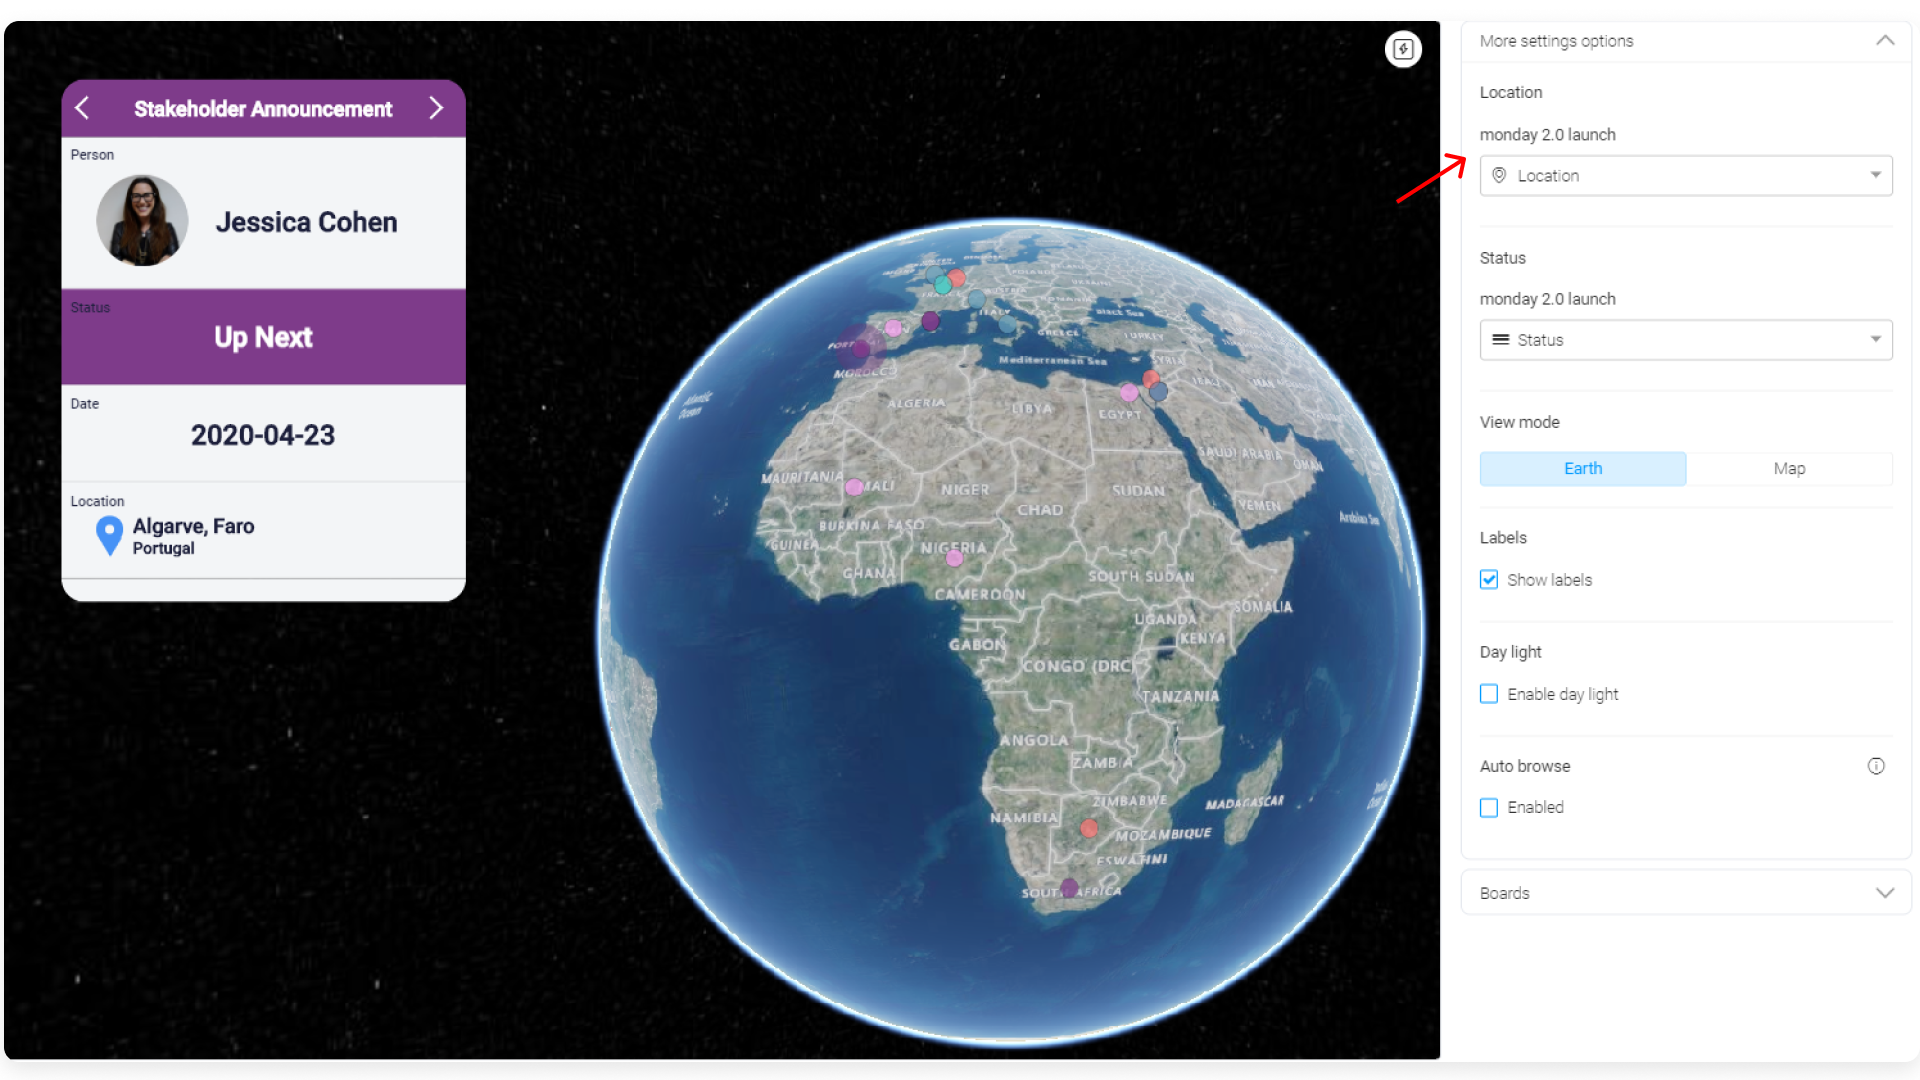
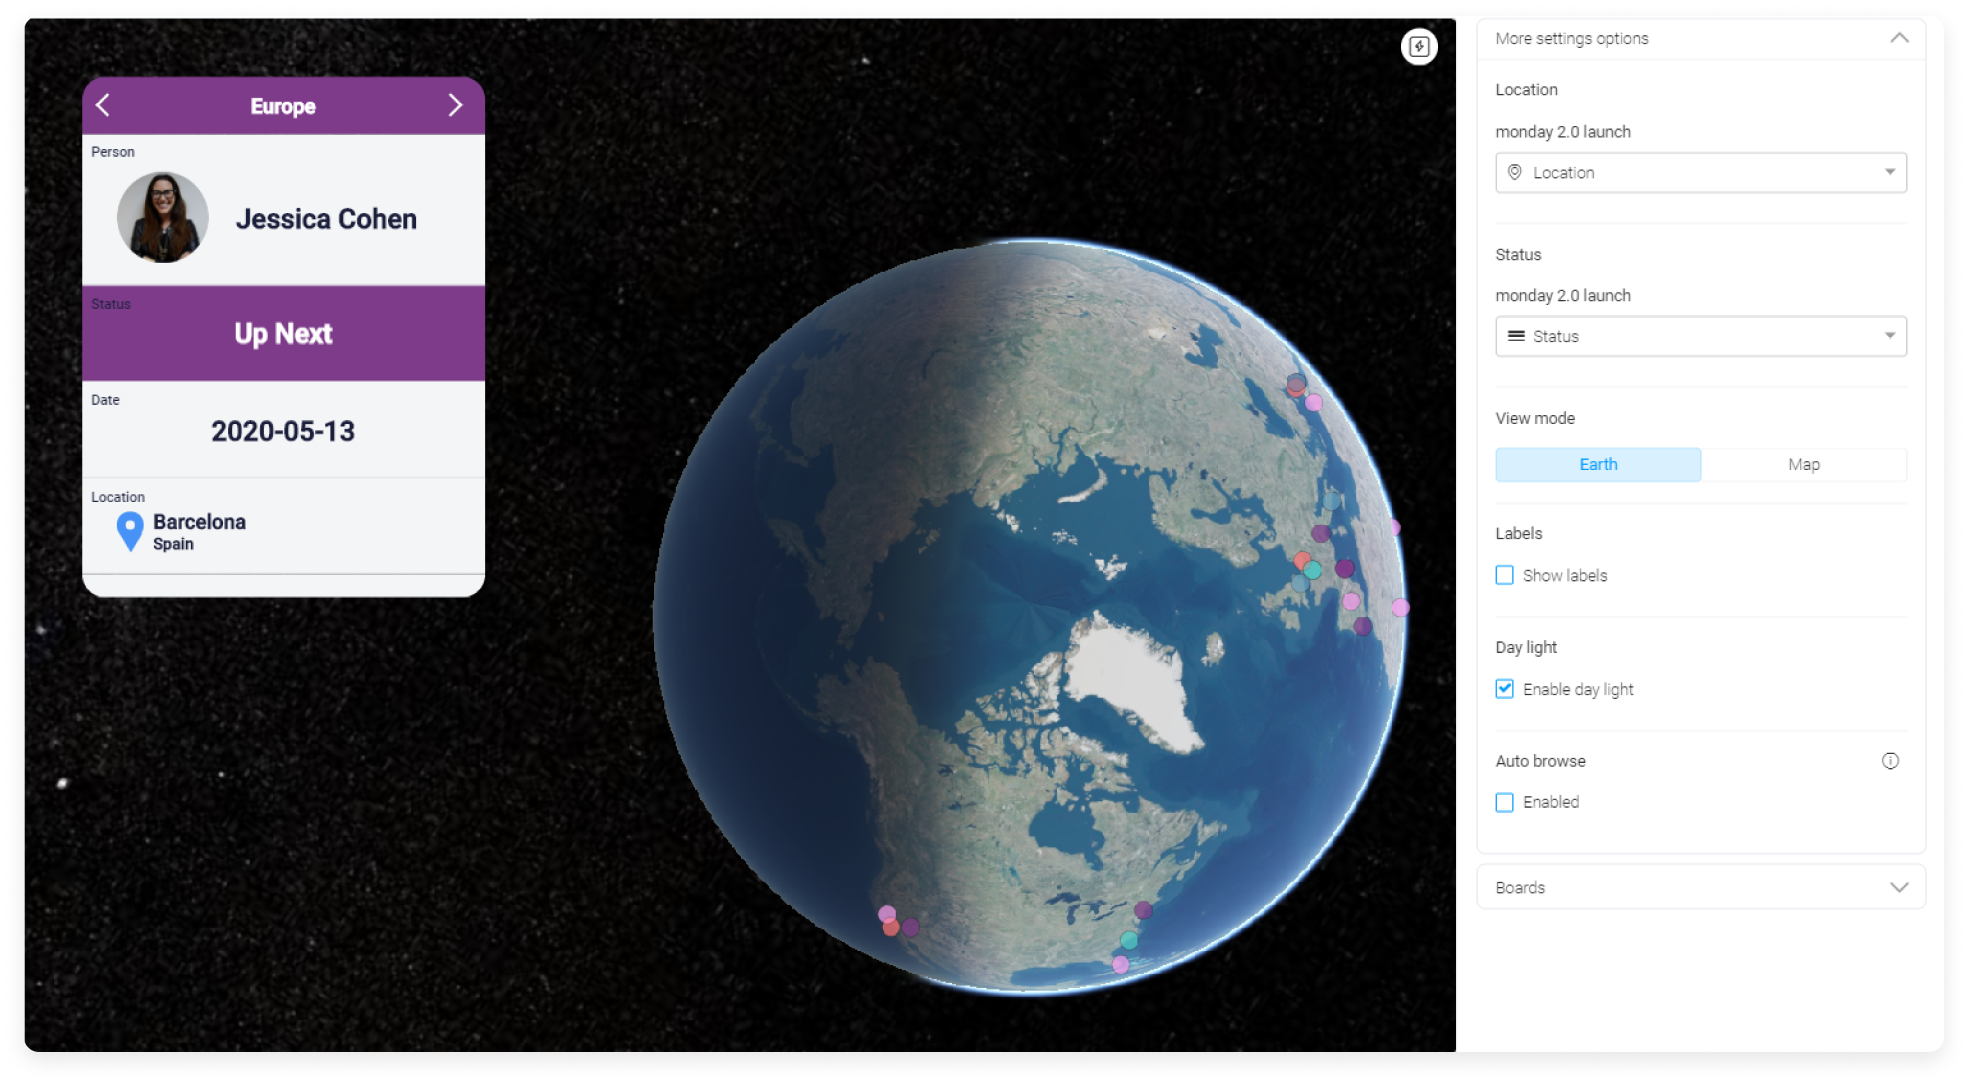
- Step 2: Select the status column
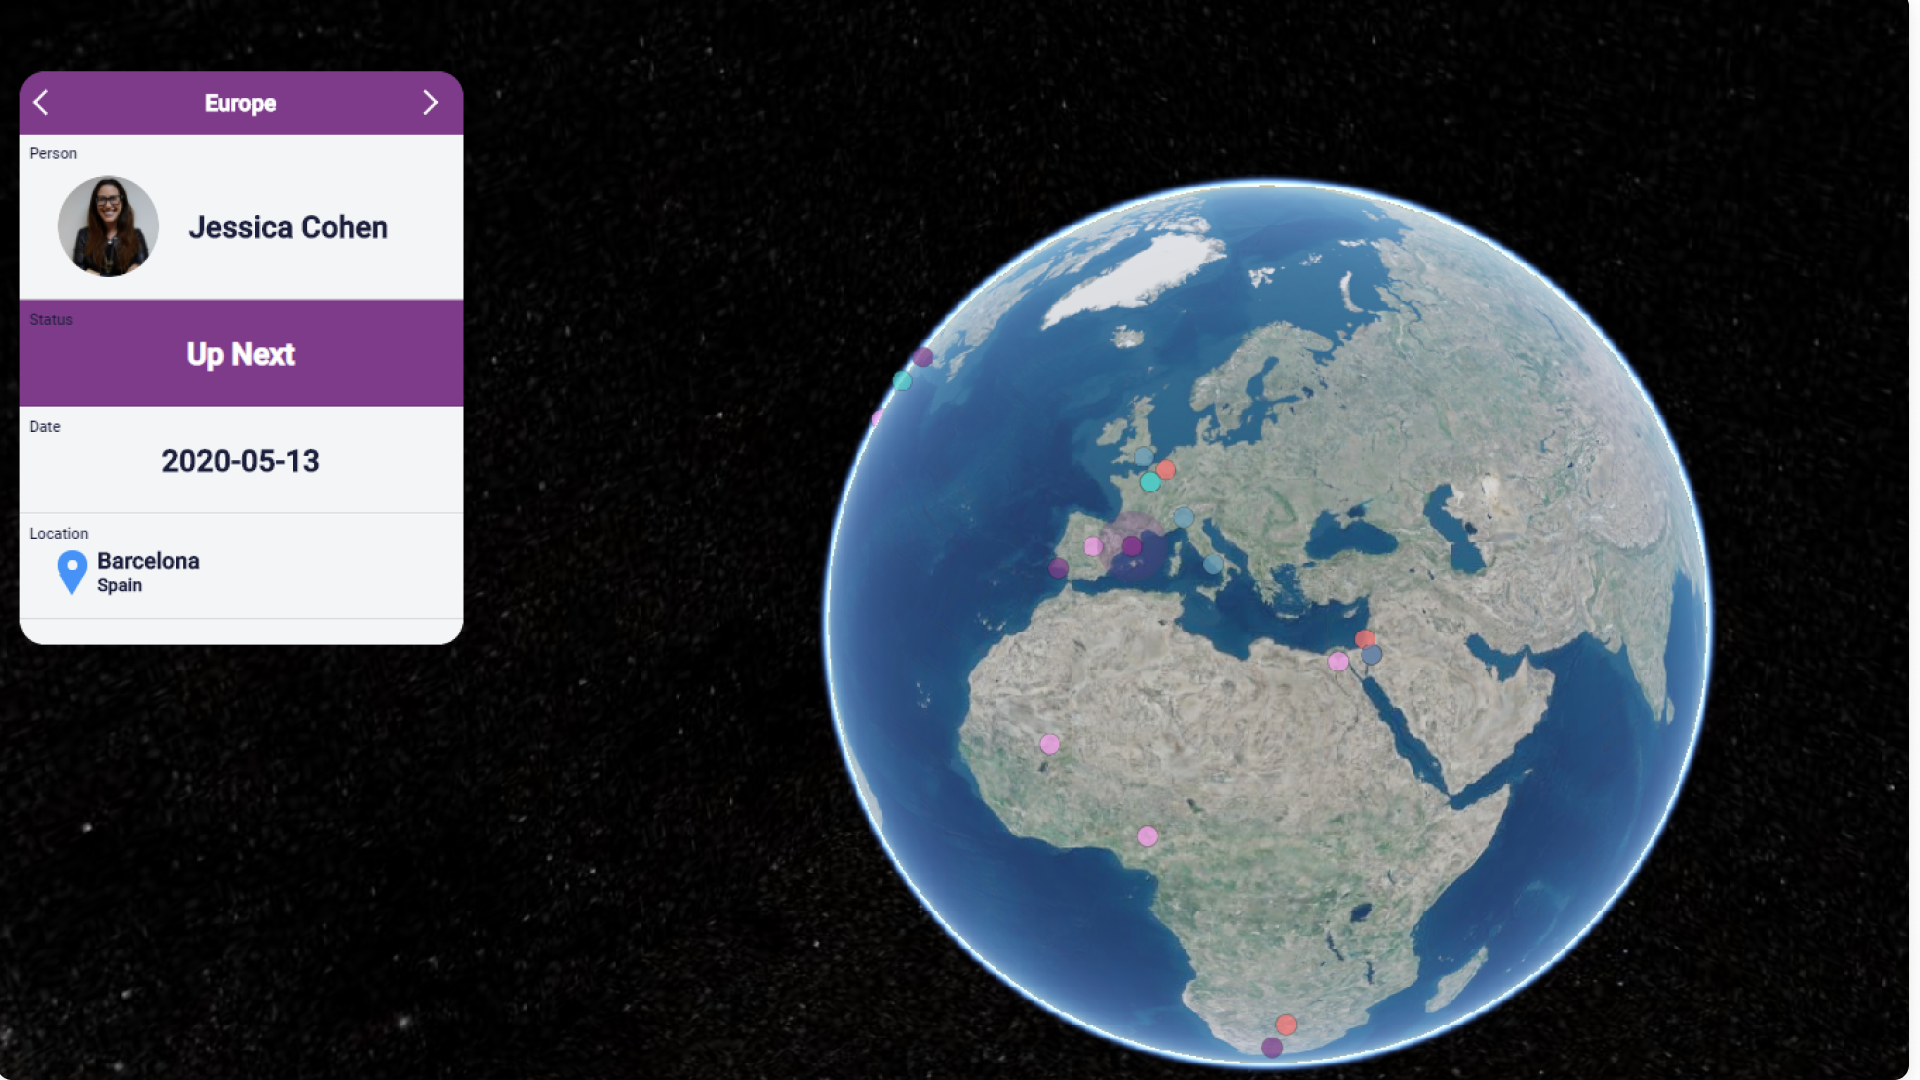
The status column will determine the color dot you will see on your Globe. This will allow you a global overview of what the status is. So, if you want to see all the tasks coming "Up Next", make sure to select the status column, and look for all purple dots on the Globe (purple reflects "Up Next" on my board). This will also be the highlighted row in the card view that appears on the left of the Globe.
If you don't select any status color, all dots will appear white on your Globe.

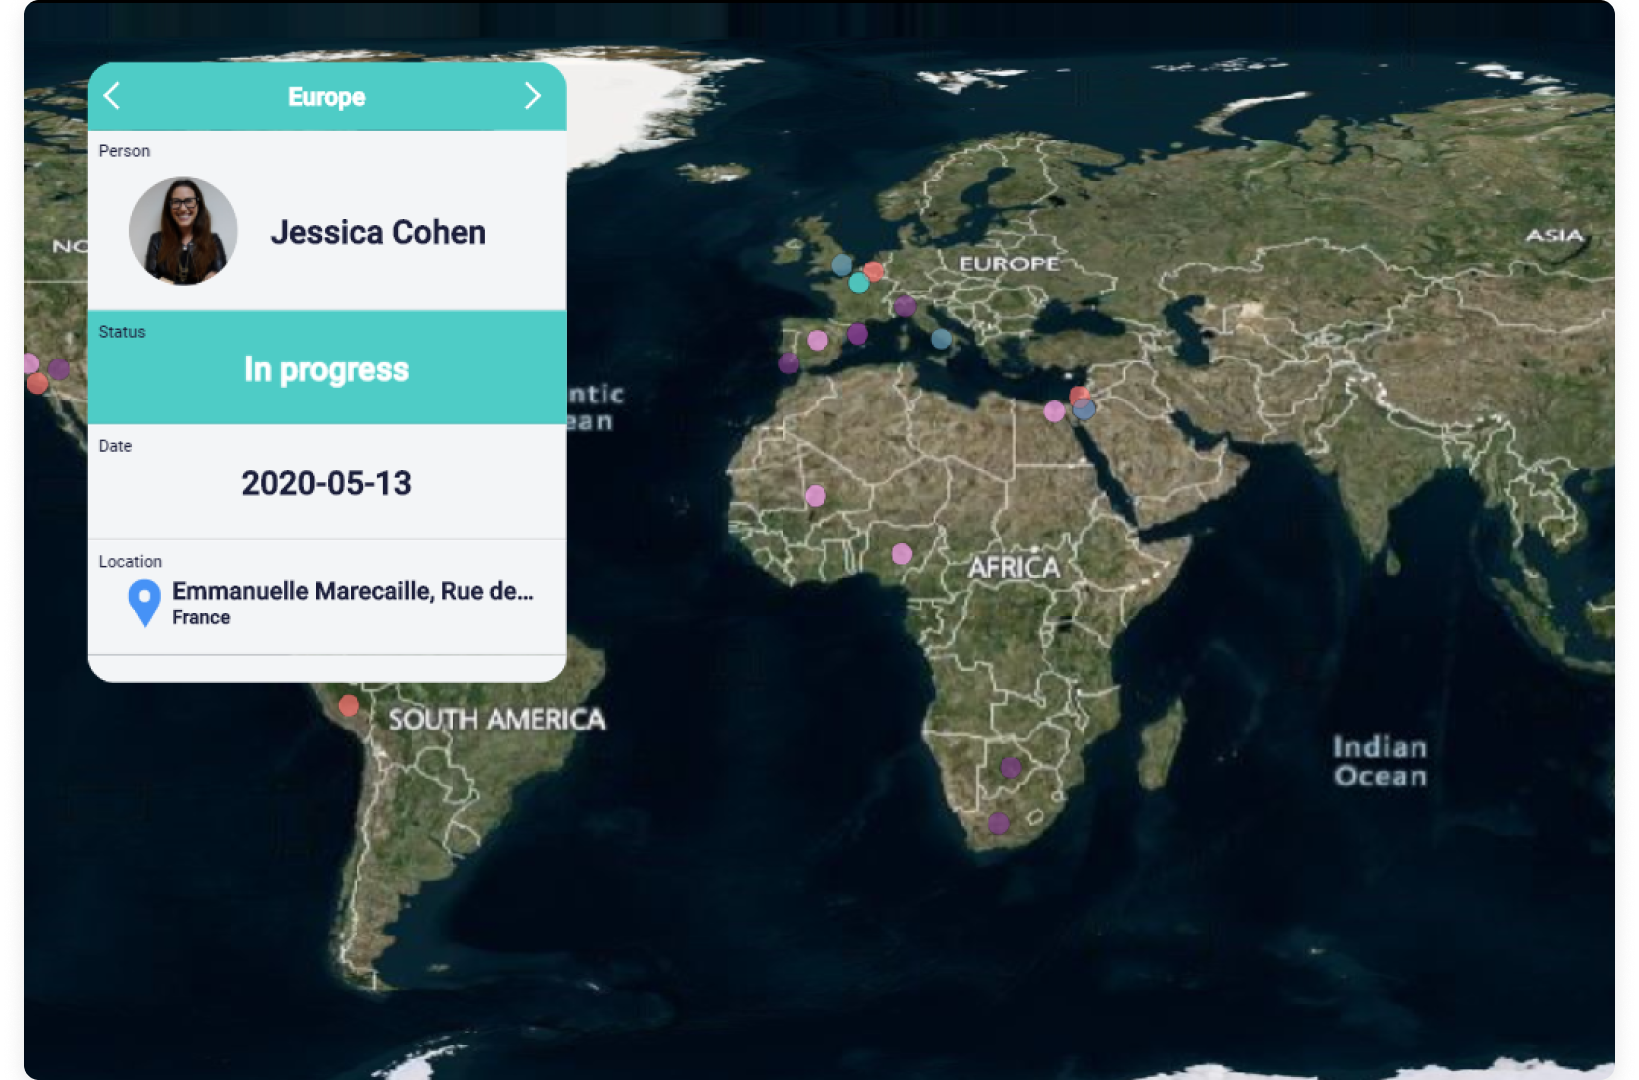
- Step 3: Select the view mode of your choice
You can switch between the Globe and Map mode to give you the exact visual representation that you'd like. Both are 3D and interactive and did we mention oh so visually pleasing?
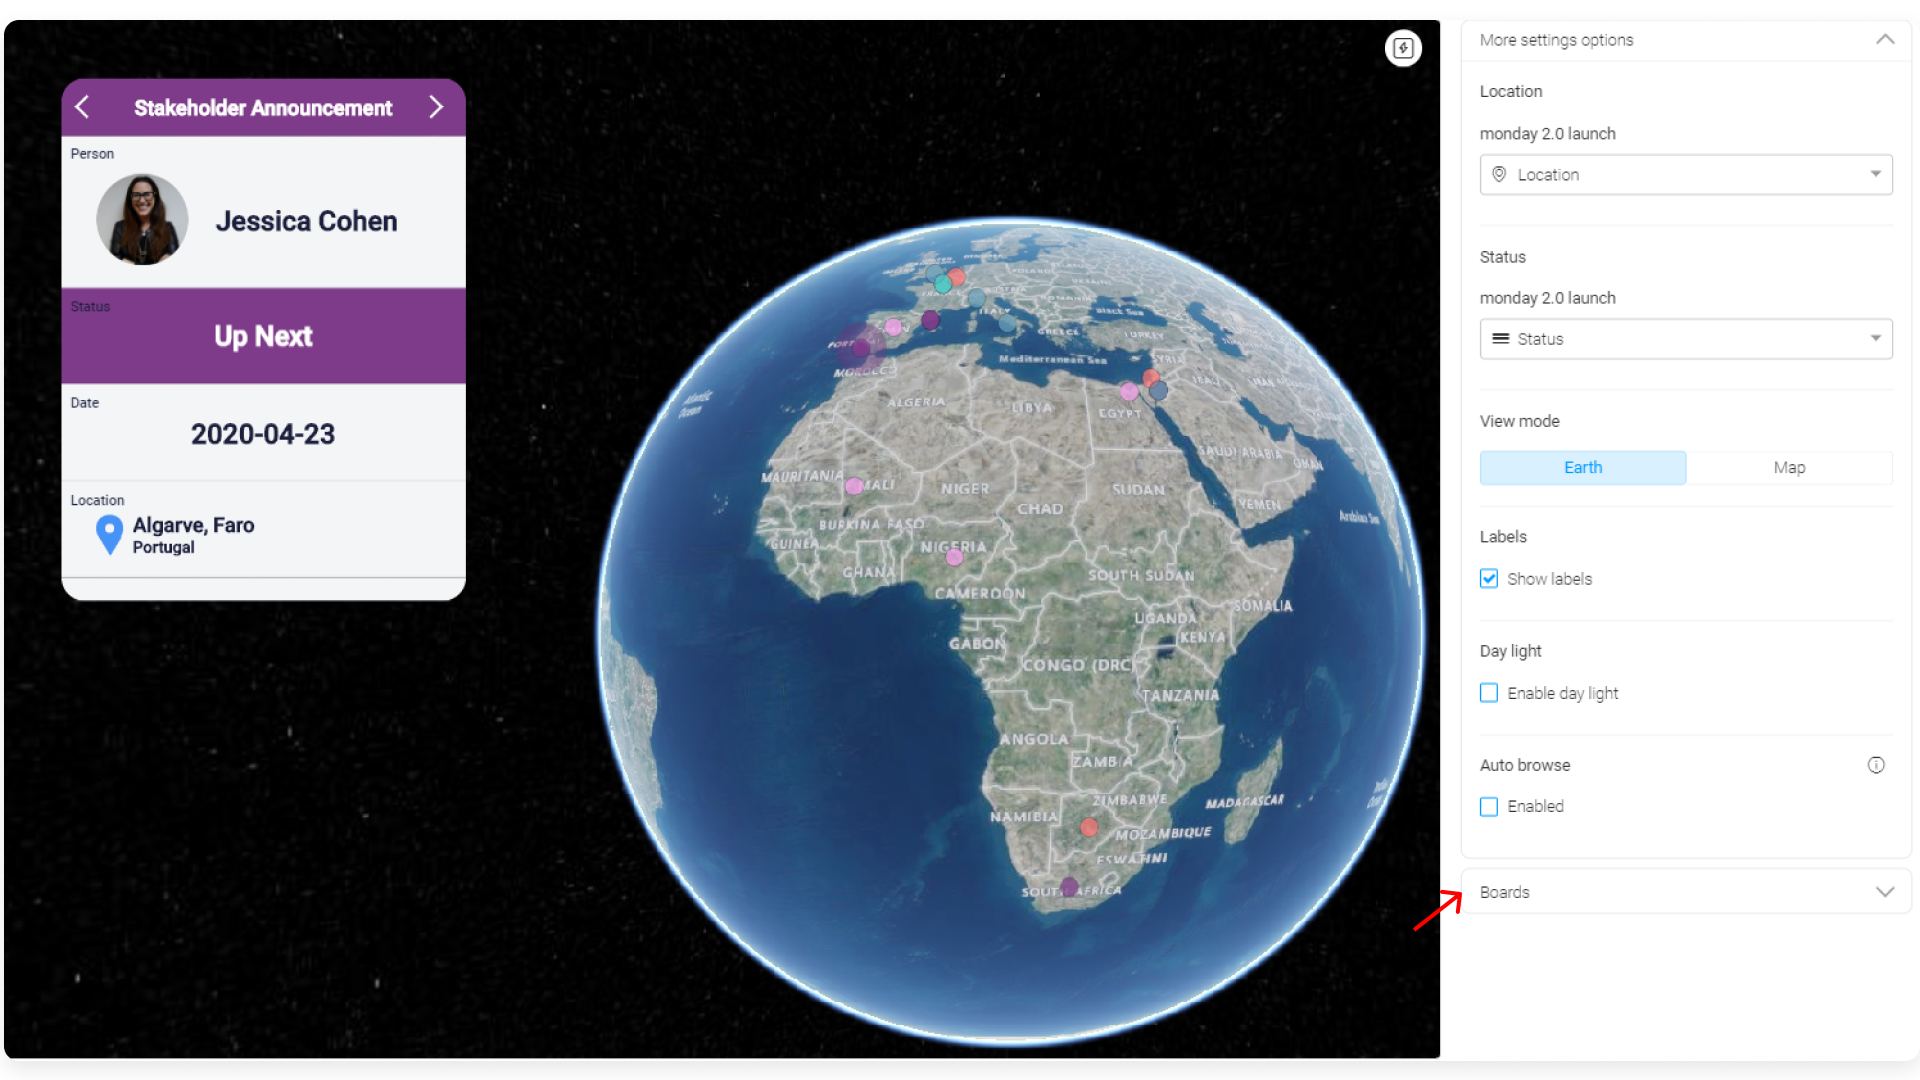
- Step 4: See the Globe with location labels or without
This setting will allow you to either see all the the location names on the Globe or not, making sure it suits your every need.
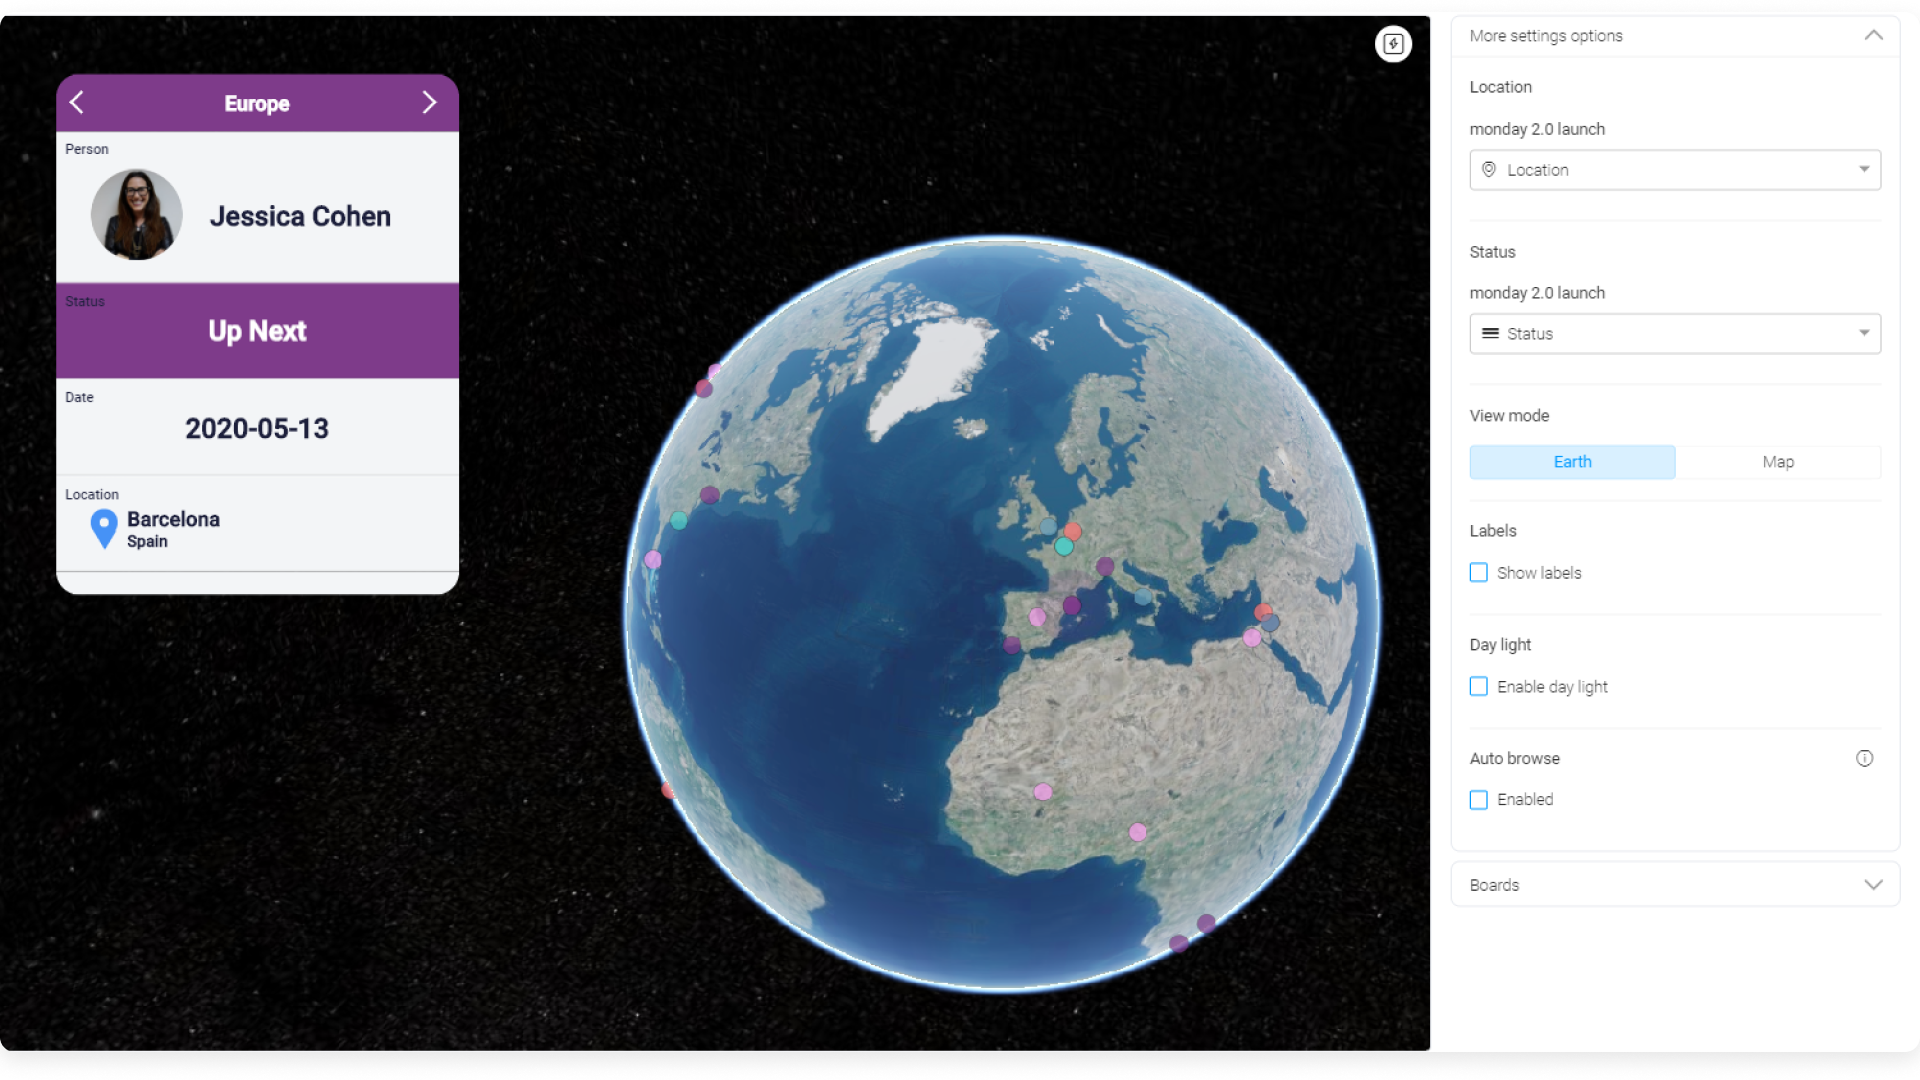
- Step 5: Make your Globe come alive with the Daylight Setting
You can make your 3D Globe come alive even more by adding in the Daylight option. This will simply light up all areas on the globe that are currently experiencing daylight and darken those in nightfall at the time you are looking at the globe. Pretty cool right?
- Step 6: Set your Globe to automatically browse each location
With the auto-browse feature enabled, your Globe will automatically jump from location to location, giving you the details on each one. By turning it off, you can simply click on each location itself and the card view will be pulled up for that item.

- Step 7: Add or remove connected boards!
The Globe widget allows you to connect multiple boards together to visualize data from across your account and put it into one unified view.
You can select which boards to analyze, by using the following setting option:
How to change the display settings?
Turn your Globe dark or light according to your preferences by selecting the light/dark mode in the display settings.
On the board view, you can also pick whether you want your Board to Globe view to be in full view or split view. By choosing the split view, you will be able to see your globe and the board itself on the same view as below:
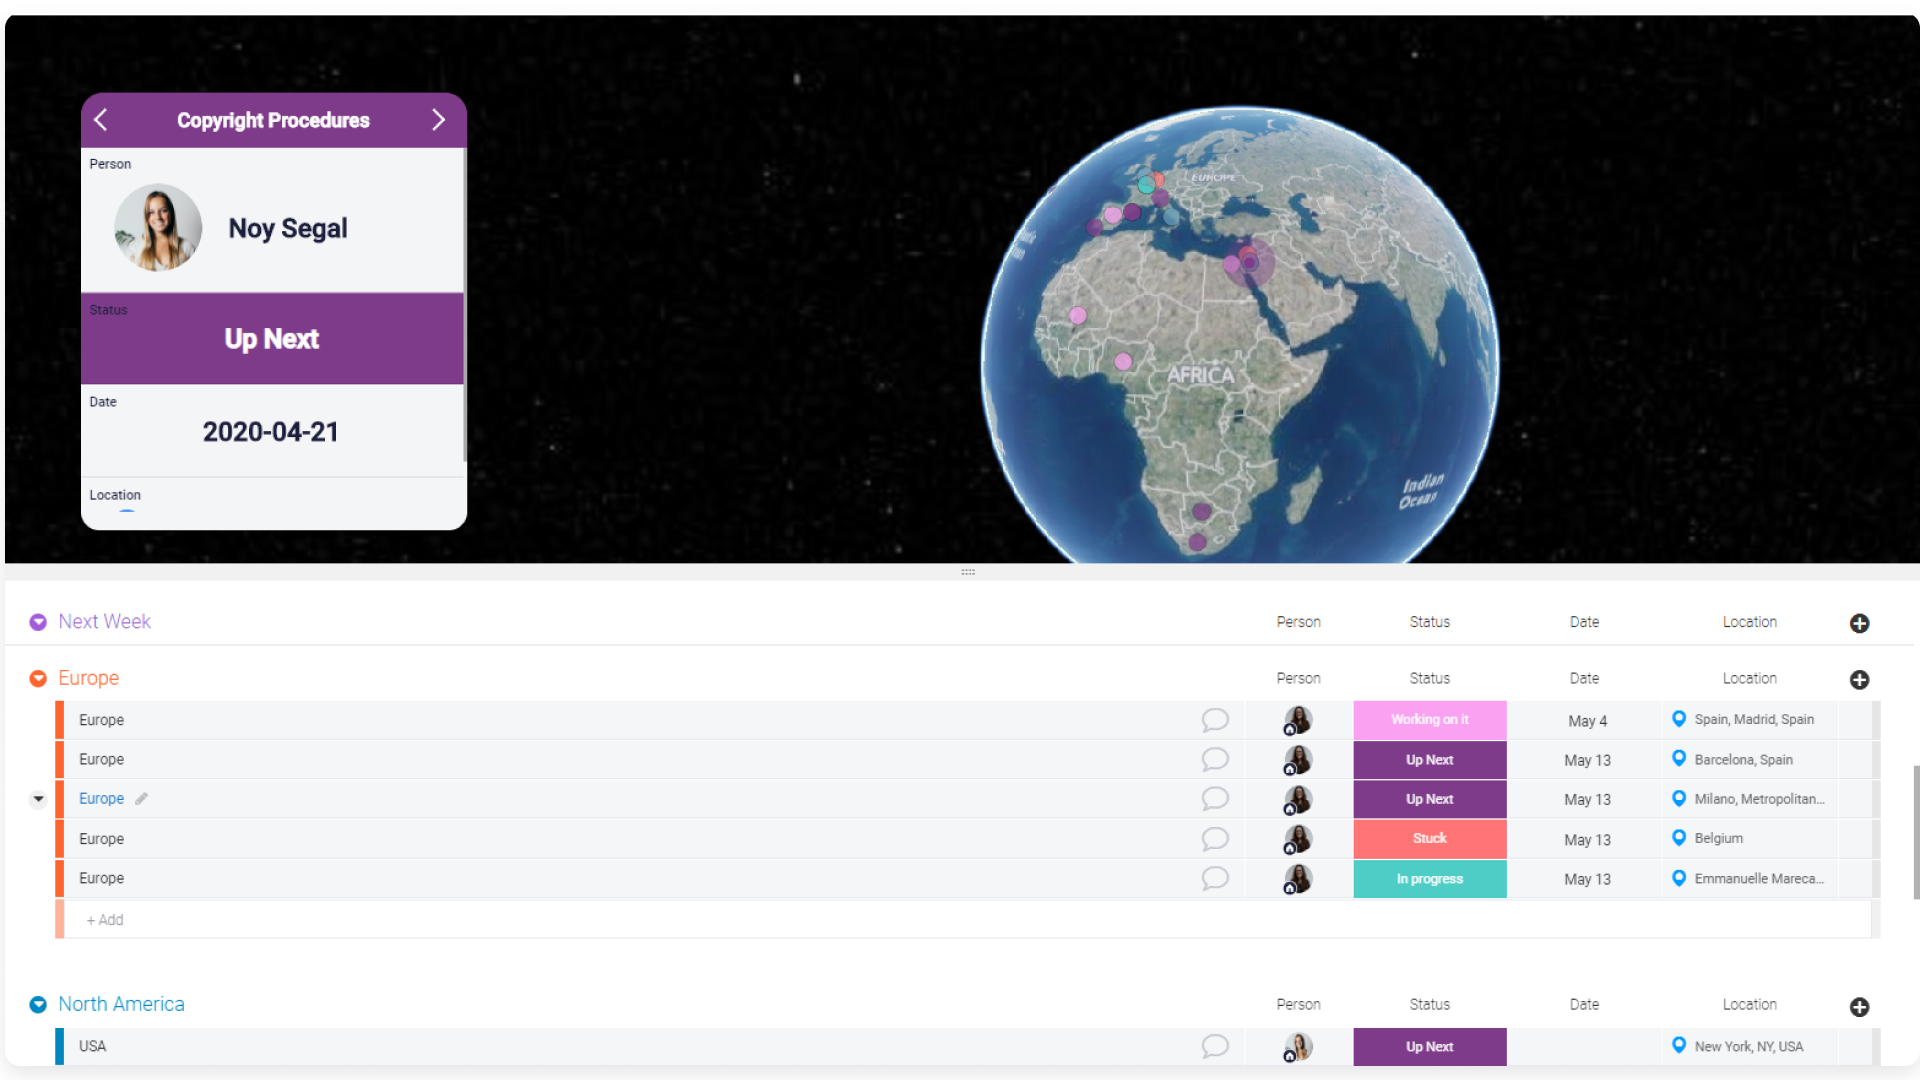
There you go! You have completed setup for your Board to Globe view and widget! You can get a visual overview of all your data points on a global scale no matter where they are!
If you have any questions, please reach out to our team right here. We’re available 24/7 and happy to help.
Comments