


Constantly maintaining an office of hundreds to thousands of employees is no easy task. With so many different requests from your employees across all departments, IT and Operations teams have got to be organized. monday.com’s super easy and flexible platform allows you the space to do exactly that!
Build your board
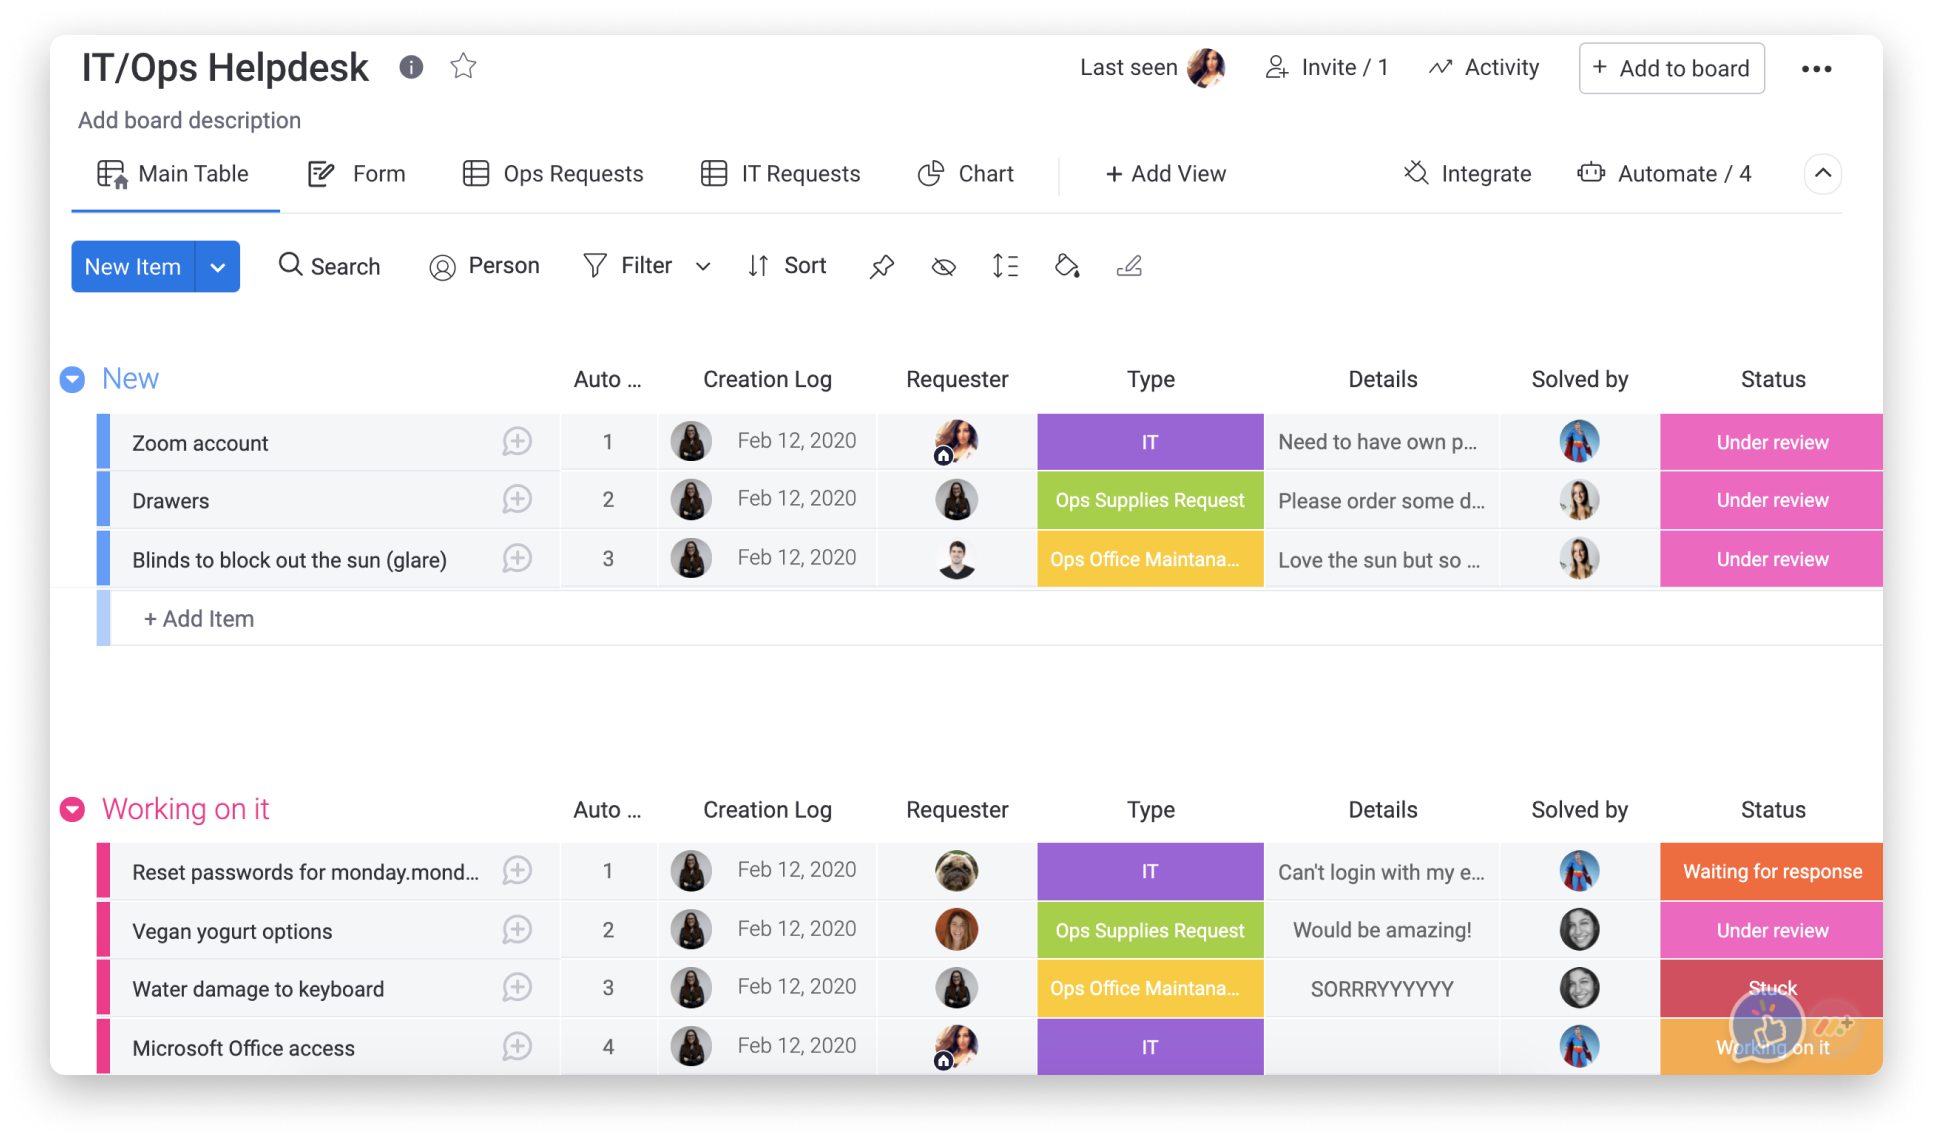
To get started, go ahead and build out your board that will be used to track all the new incoming tickets (requests) received by your employees. Your board can be set up in various different ways, however we’ll focus on how we currently use monday.com as our internal Helpdesk.
- Groups
You can organize your groups based on the new tickets, tickets being worked on and solved tickets. The first group will house all new requests that the IT/Ops teams receive. This group will remain at the top and be an indication of all the requests that haven’t been delegated yet.
- Items
Once you have set up your groups, you can start adding your items. An item will be every ticket added by the employees such as requests for office equipment, maintenance, software licenses, reset passwords and so on.
- Columns
Columns allow you to track and manage every ticket received and to gather all relevant information in one centralized place. This allows you to put status updates, categorize tickets and manage day-to-day activities. With over 20 different column types, there’s really no limit to how you can customize your board to fit your team’s needs.

Gather your requests
Now that you have the basics of your board set up, you can flip it into a Shareable Form to ensure that both Ops and IT have a simple, streamlined and accessible process to receive and manage these requests. To turn this board into a Form, you’ll need to add the Form View to the board.
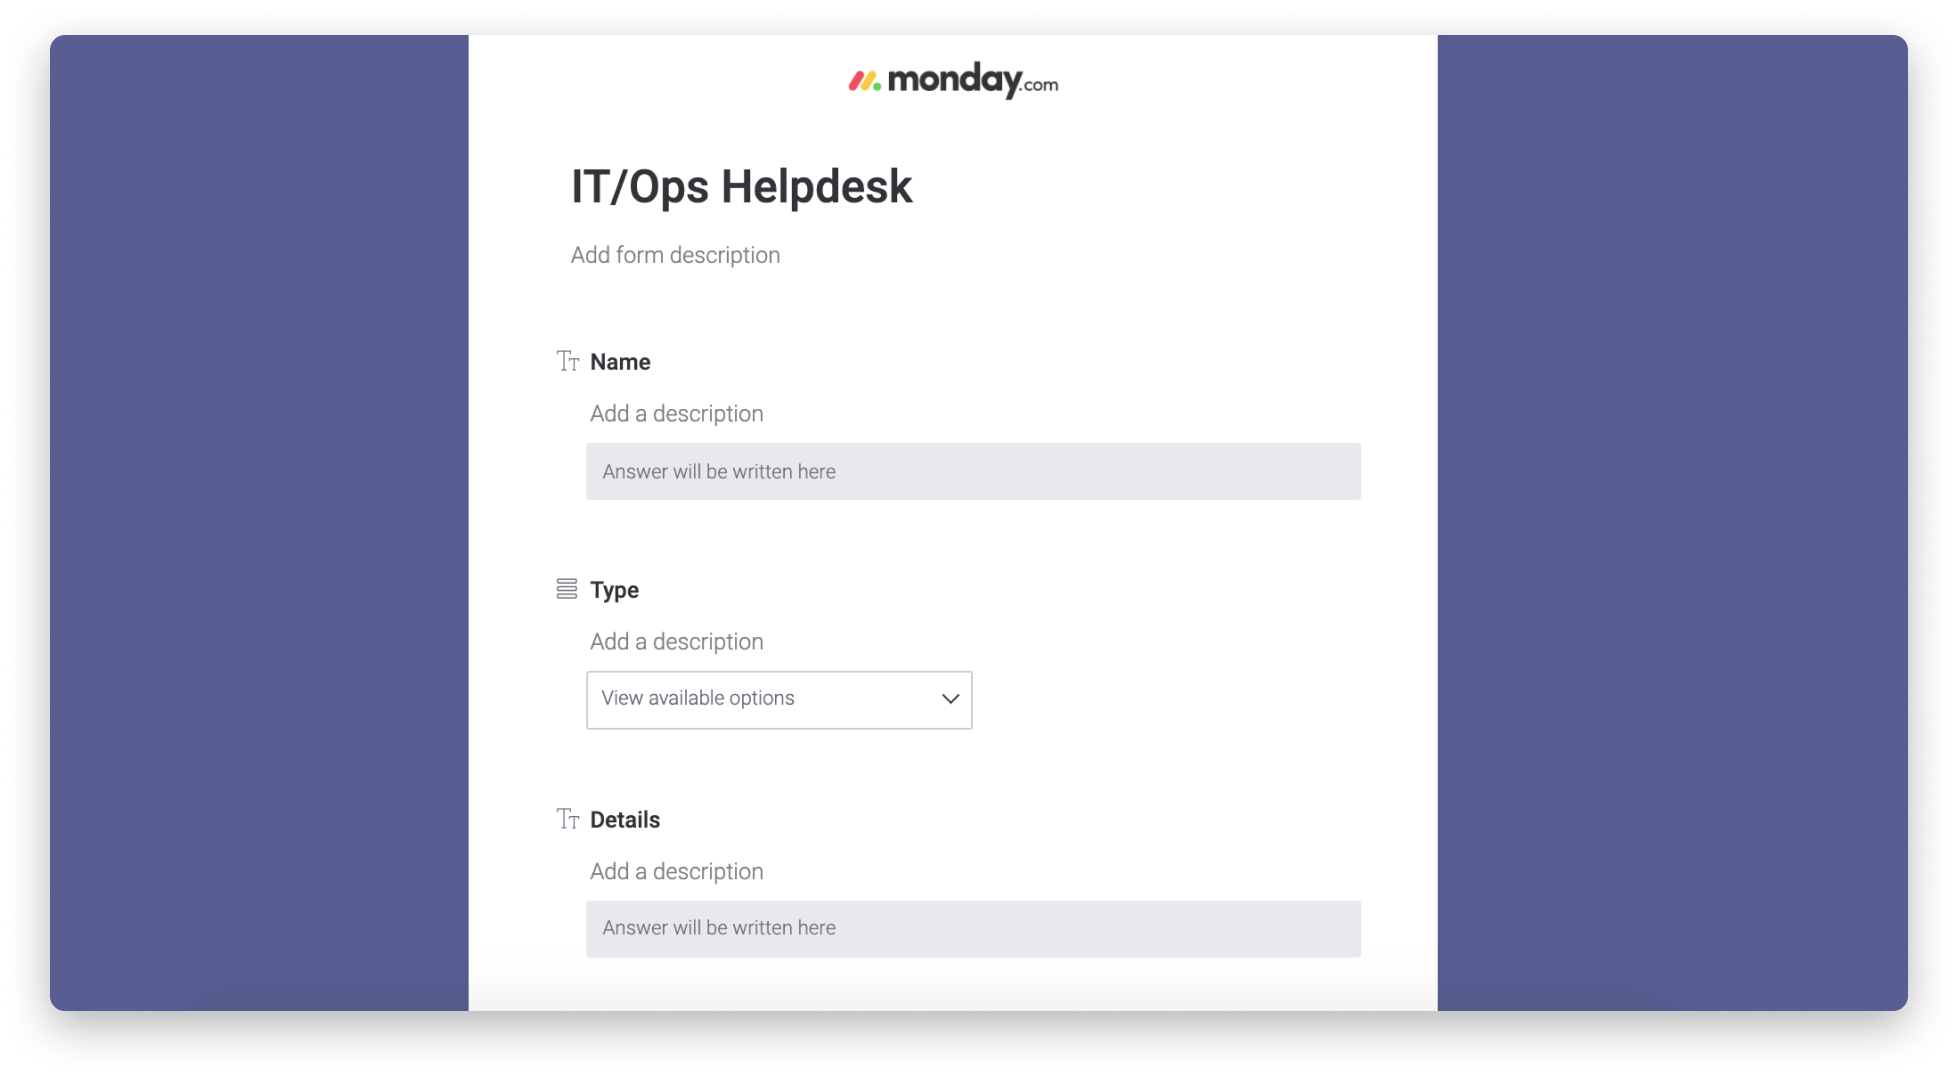
Once a form is filled, it will automatically create a new request in your board.
Automate your workflow
Automations will bring you a few steps closer to completely automating your workflows, eliminating unnecessary wasted time and natural human errors that happen on the way. These are just some useful automations you should be adding to this board:
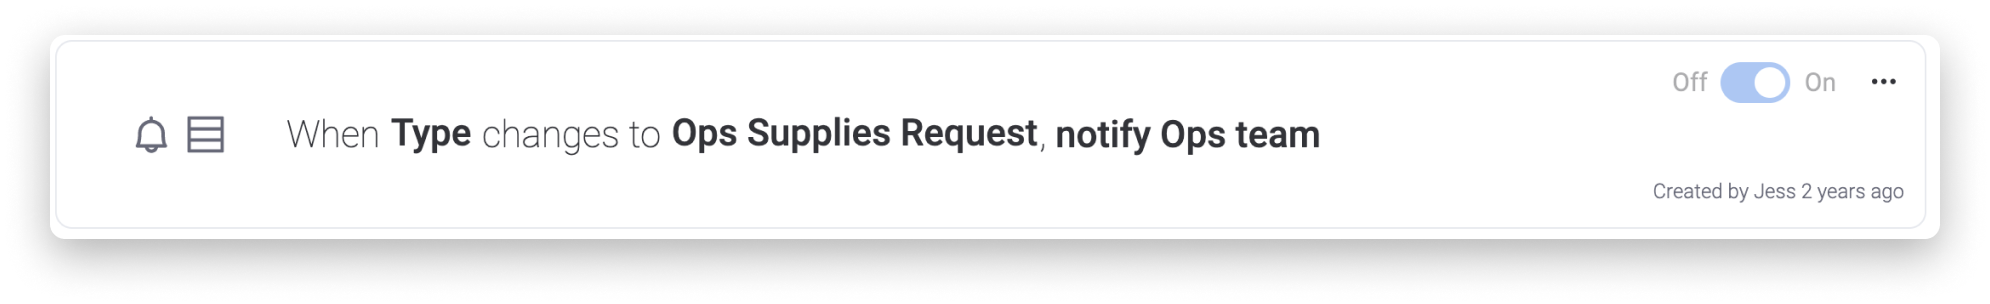
- Whenever a new ticket is marked with a specific label , such as “Ops Supplies Requests”, an automatic notification is sent to the Ops team to notify them.
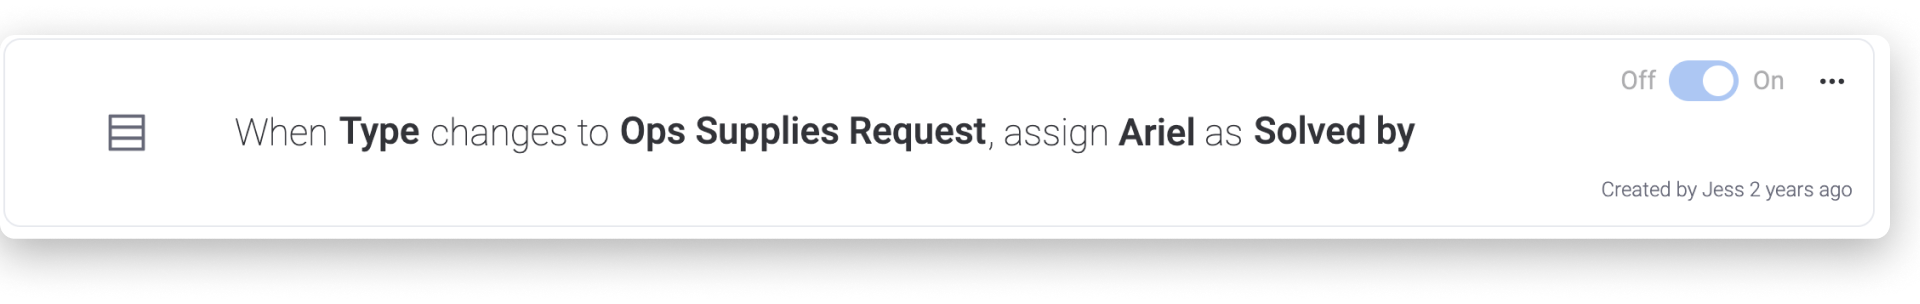
- We can take this one step further, and even assign it to a specific person in the Ops team using this automation:
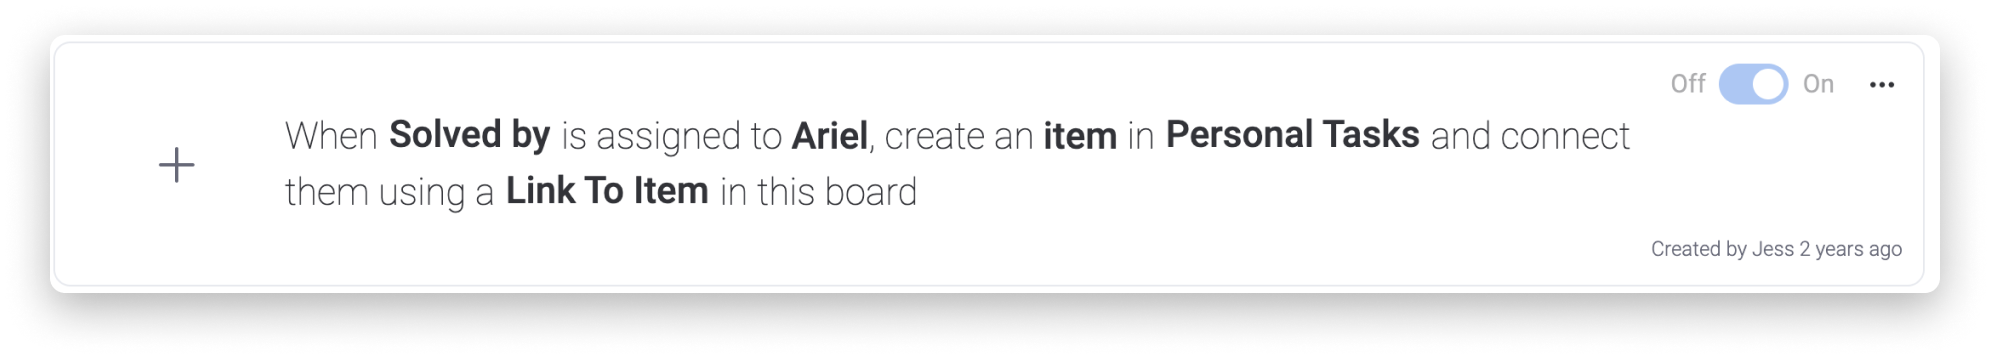
- We can then make sure that the person who is assigned to this request also sees this task on his own personal to-do-list by using this cross board automation:
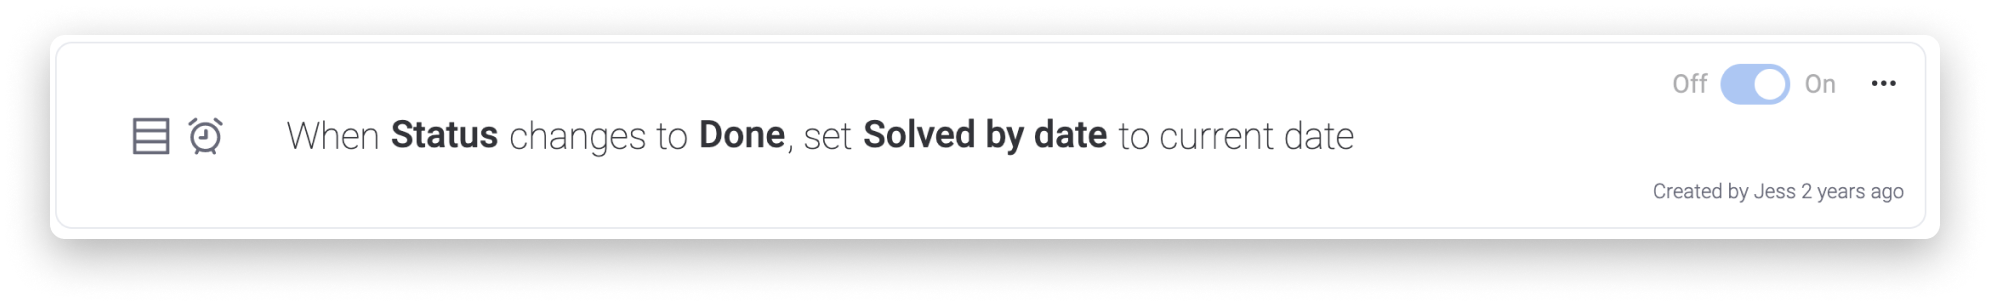
- Lastly, we can automatically set the Solved by date, using this automation:
Track handling time
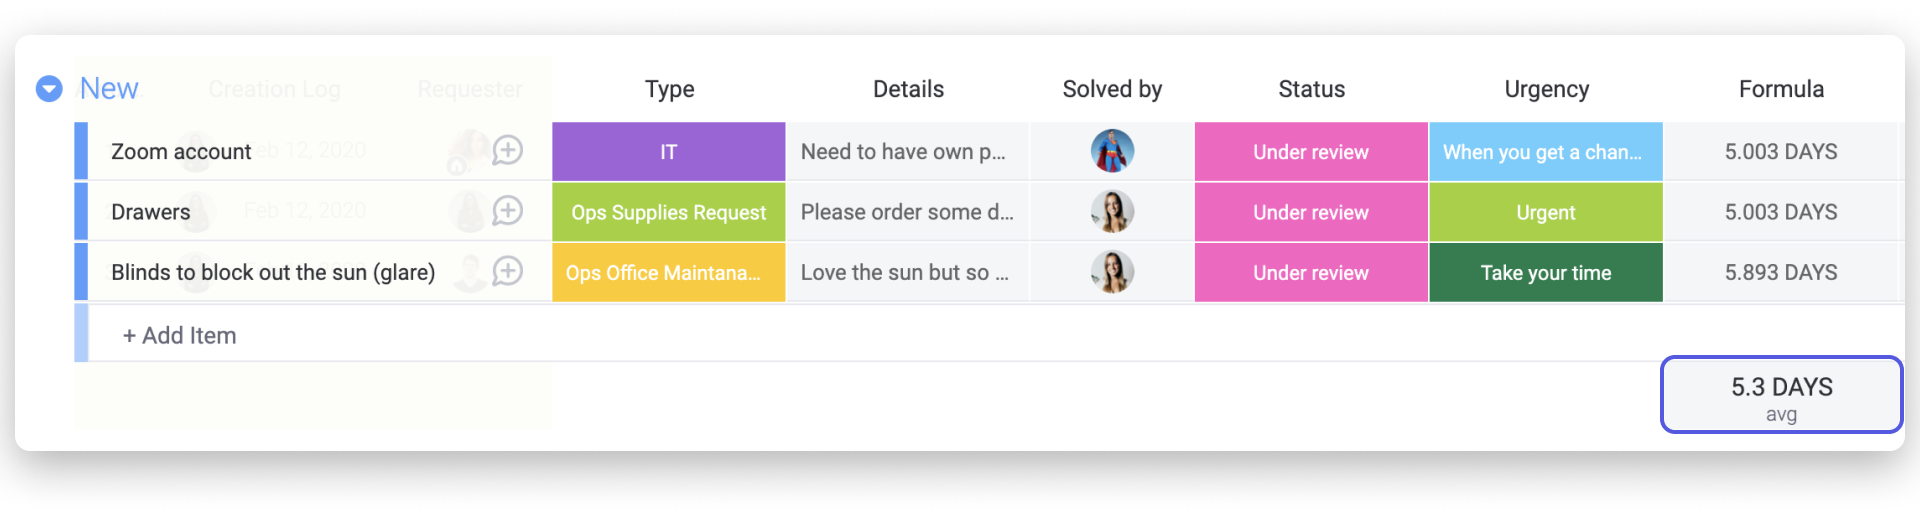
As with all Helpdesks, handling time is a super important metric that you’re going to want to track. To track the time since receiving the ticket, to when the ticket was solved (remember the automation we just added? :) ), we’re going to use a Formula column. Here, we can use a simple formula to calculate the time between the Creation log column and Solved by Date column:
This will enable you to see the exact time between the ticket was created and solved for each ticket, but also see the overall average handling time of the tickets (at the bottom of the column).
Analyze your requests
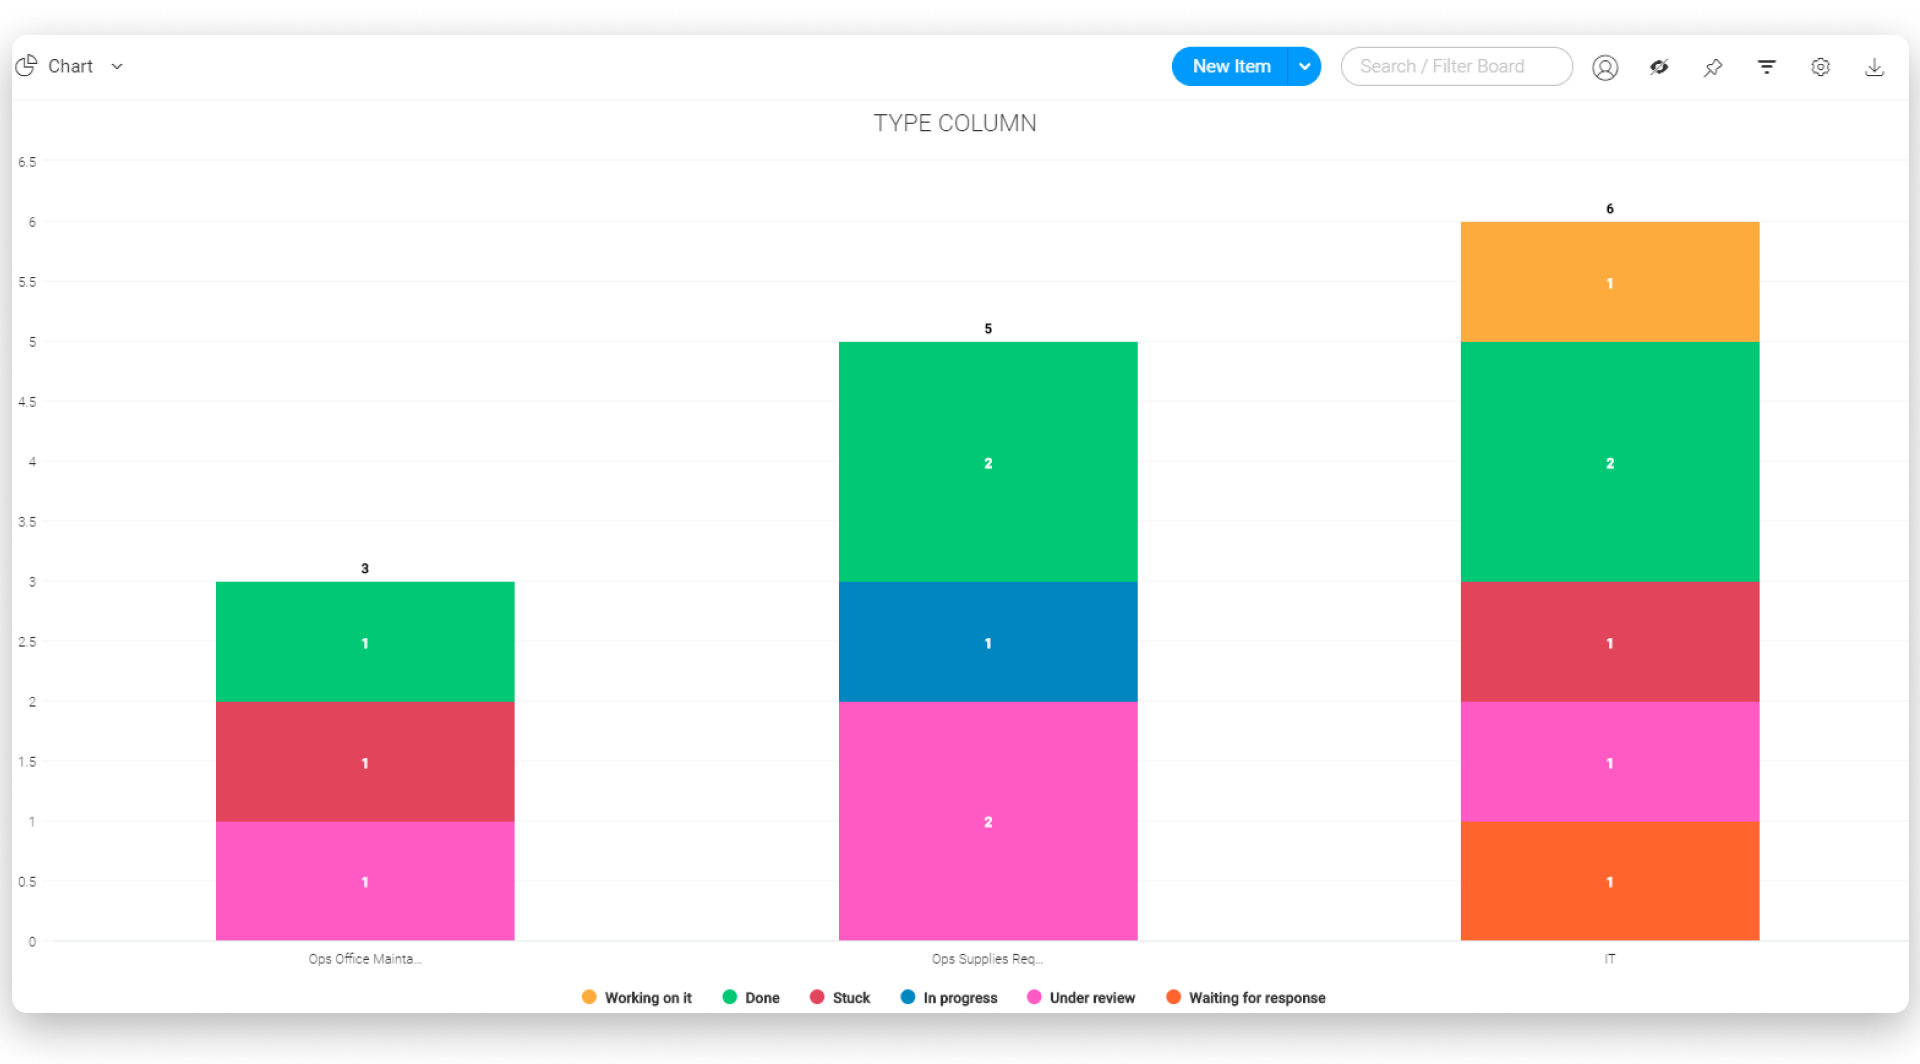
Board views are a great way to visualize information on your board in a different way, to see breakdowns and analytics, allowing your team to make more informed decisions later on. Here, we are using the Chart View to show a breakdown of the Type of Requests (per department), stacked by their Status, such that we can compare which type of requests have more completed requests, stuck requests and so on.
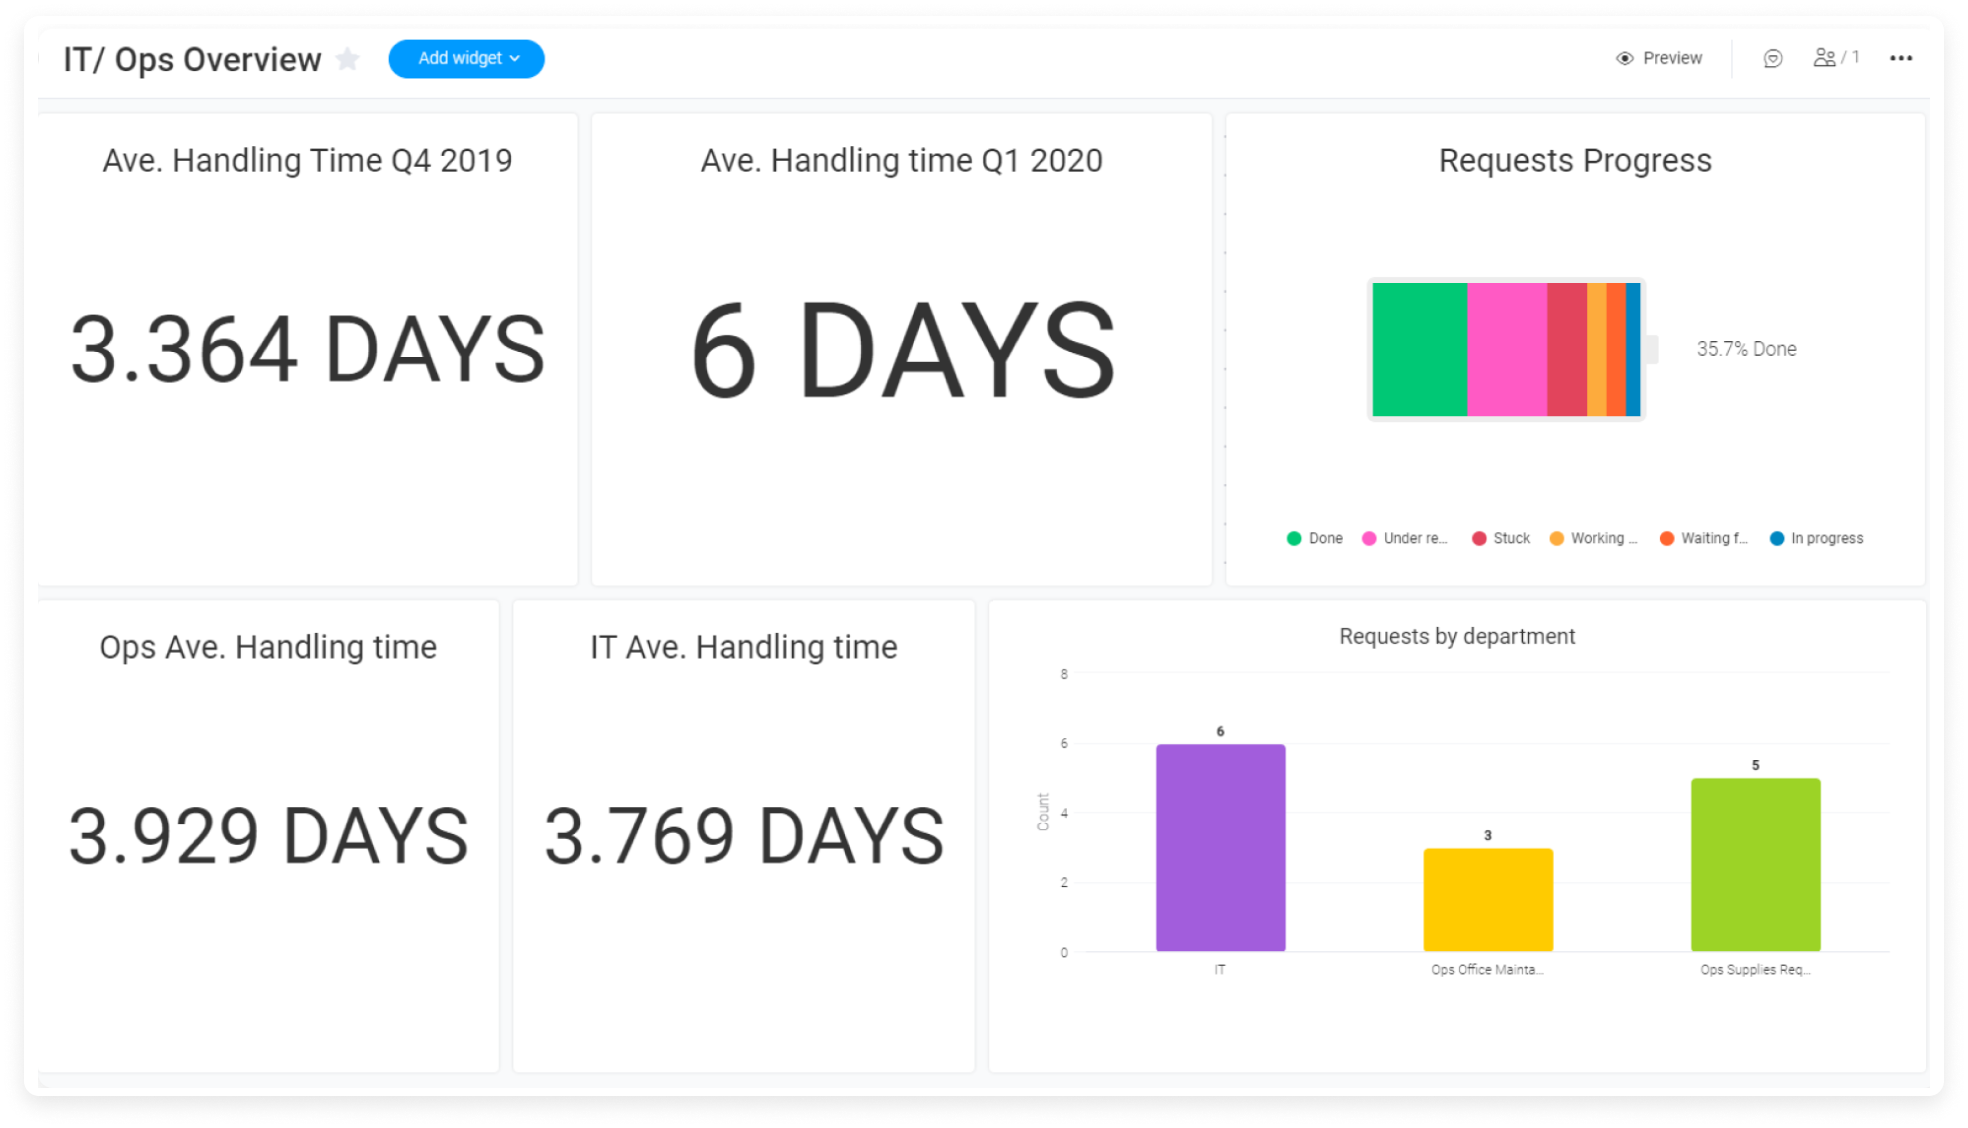
Get high level insights
Dashboards, like views, provide you with high level insights about the data on your boards, with the additional functionality of seeing cross-account data. This allows you to pull info from various different boards to gain overviews that are much needed.
This is great if you’re looking to compare handling time of requests by department over time, manage your team’s workload, see employee performance and get a general overview of the progress of your requests.
There you have it! You’re ready to get started streamlining and managing your internal Helpdesk with monday.com.
If you have any questions, please reach out to our team right here. We’re available 24/7 and happy to help.
Comments